Exploring and understanding the individual experience from longitudinal data, or…
How to make better spaghetti (plots)
Nicholas Tierney, Monash University
OzVis
Thursday 21st November, 2019
bit.ly/njt-ozvis
nj_tierney
(My) Background
I want to talk a bit about where I've started from, because I think it might be useful to understand my perspective, and why I'm interested in doing these things.
Background: Undergraduate
Undergraduate in Psychology
- Statistics
- Experiment Design
- Cognitive Theory
- Neurology
- Humans

Background: Honours
Psychophysics: illusory contours in 3D

Phil Grove

Background: Honours

Christina Lee
If every psychologist in the world delivered gold standard smoking cessation therapy, the rate of smoking would still increase. You need to change policy to make change. To make effective policy, you need to have good data, and do good statistics.
I discovered an interest in public health and statistics.
Background: PhD

Kerrie Mengersen
- Statistical Approaches to Revealing Structure in Complex Health Data
- Exploring missing values
- Bayesian Models of people's health over time
- Geospatial statistics of cardiac arrest
- Fun, applied, real data, real people
Background: PhD
- "Ah, statistics, everything is black and white!
- "There's always an answer"
- "data in, answer out"
I started a PhD in statistics at QUT, under (now distinguished) Professor Kerrie Mengersen, Looking at people's health over time.
- There were several things that I noticed:
- There were equations, but not as many clear-cut, black and white answers
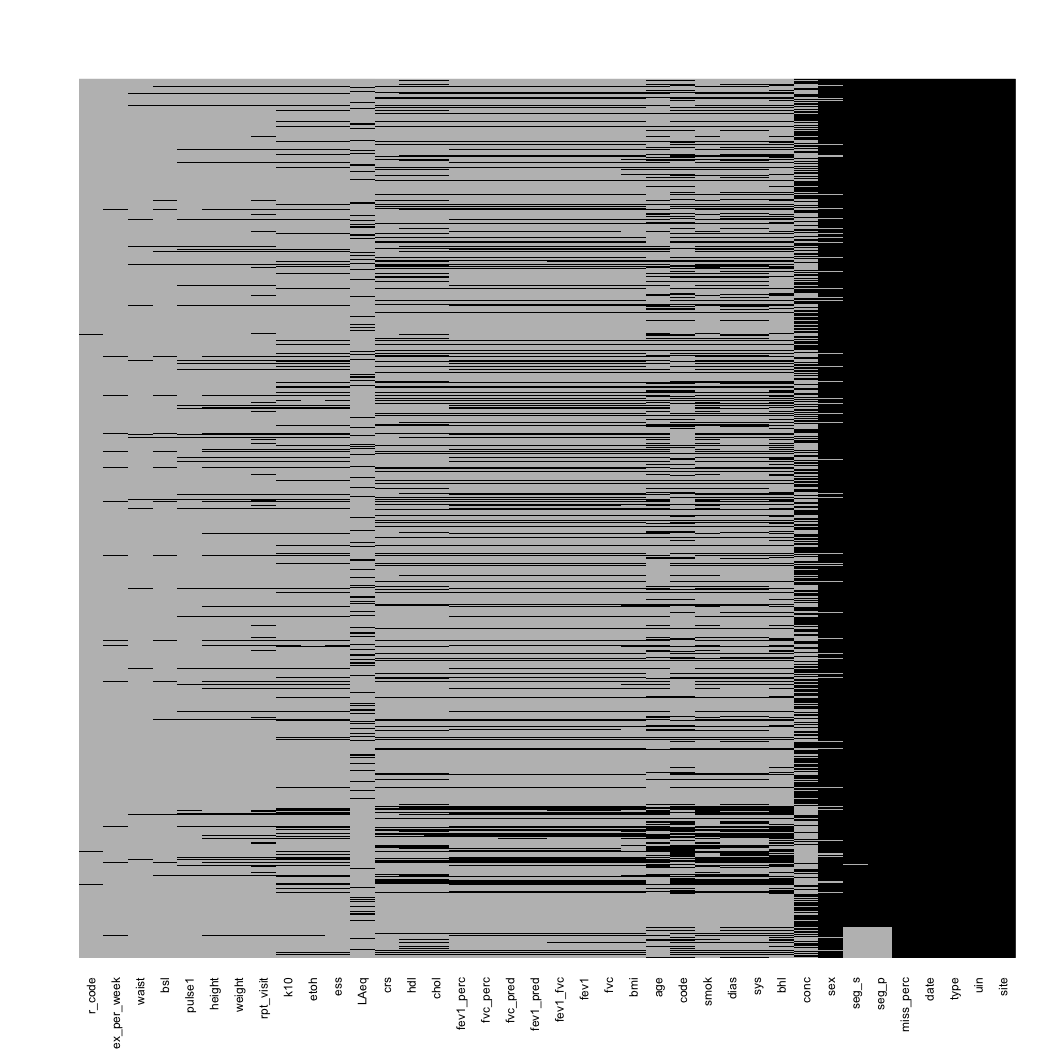
😱 Missing Values
Journey of Analytic Discovery
- map
Background: PhD
- Data is really messy
- Missing values are frustrating
- How to Explore data?

Background: PhD - But in psych
- Focus on experiment design
- No focus on exploring data
- Exploring data felt...wrong?
- But it was so critical.

(My personal) motivation
A lot of research in new statistical methods - imputation, inference, prediction
(My personal) motivation
A lot of research in new statistical methods - imputation, inference, prediction
Not much research on how we explore our data, and the methods that we use to do this.
(My personal) motivation
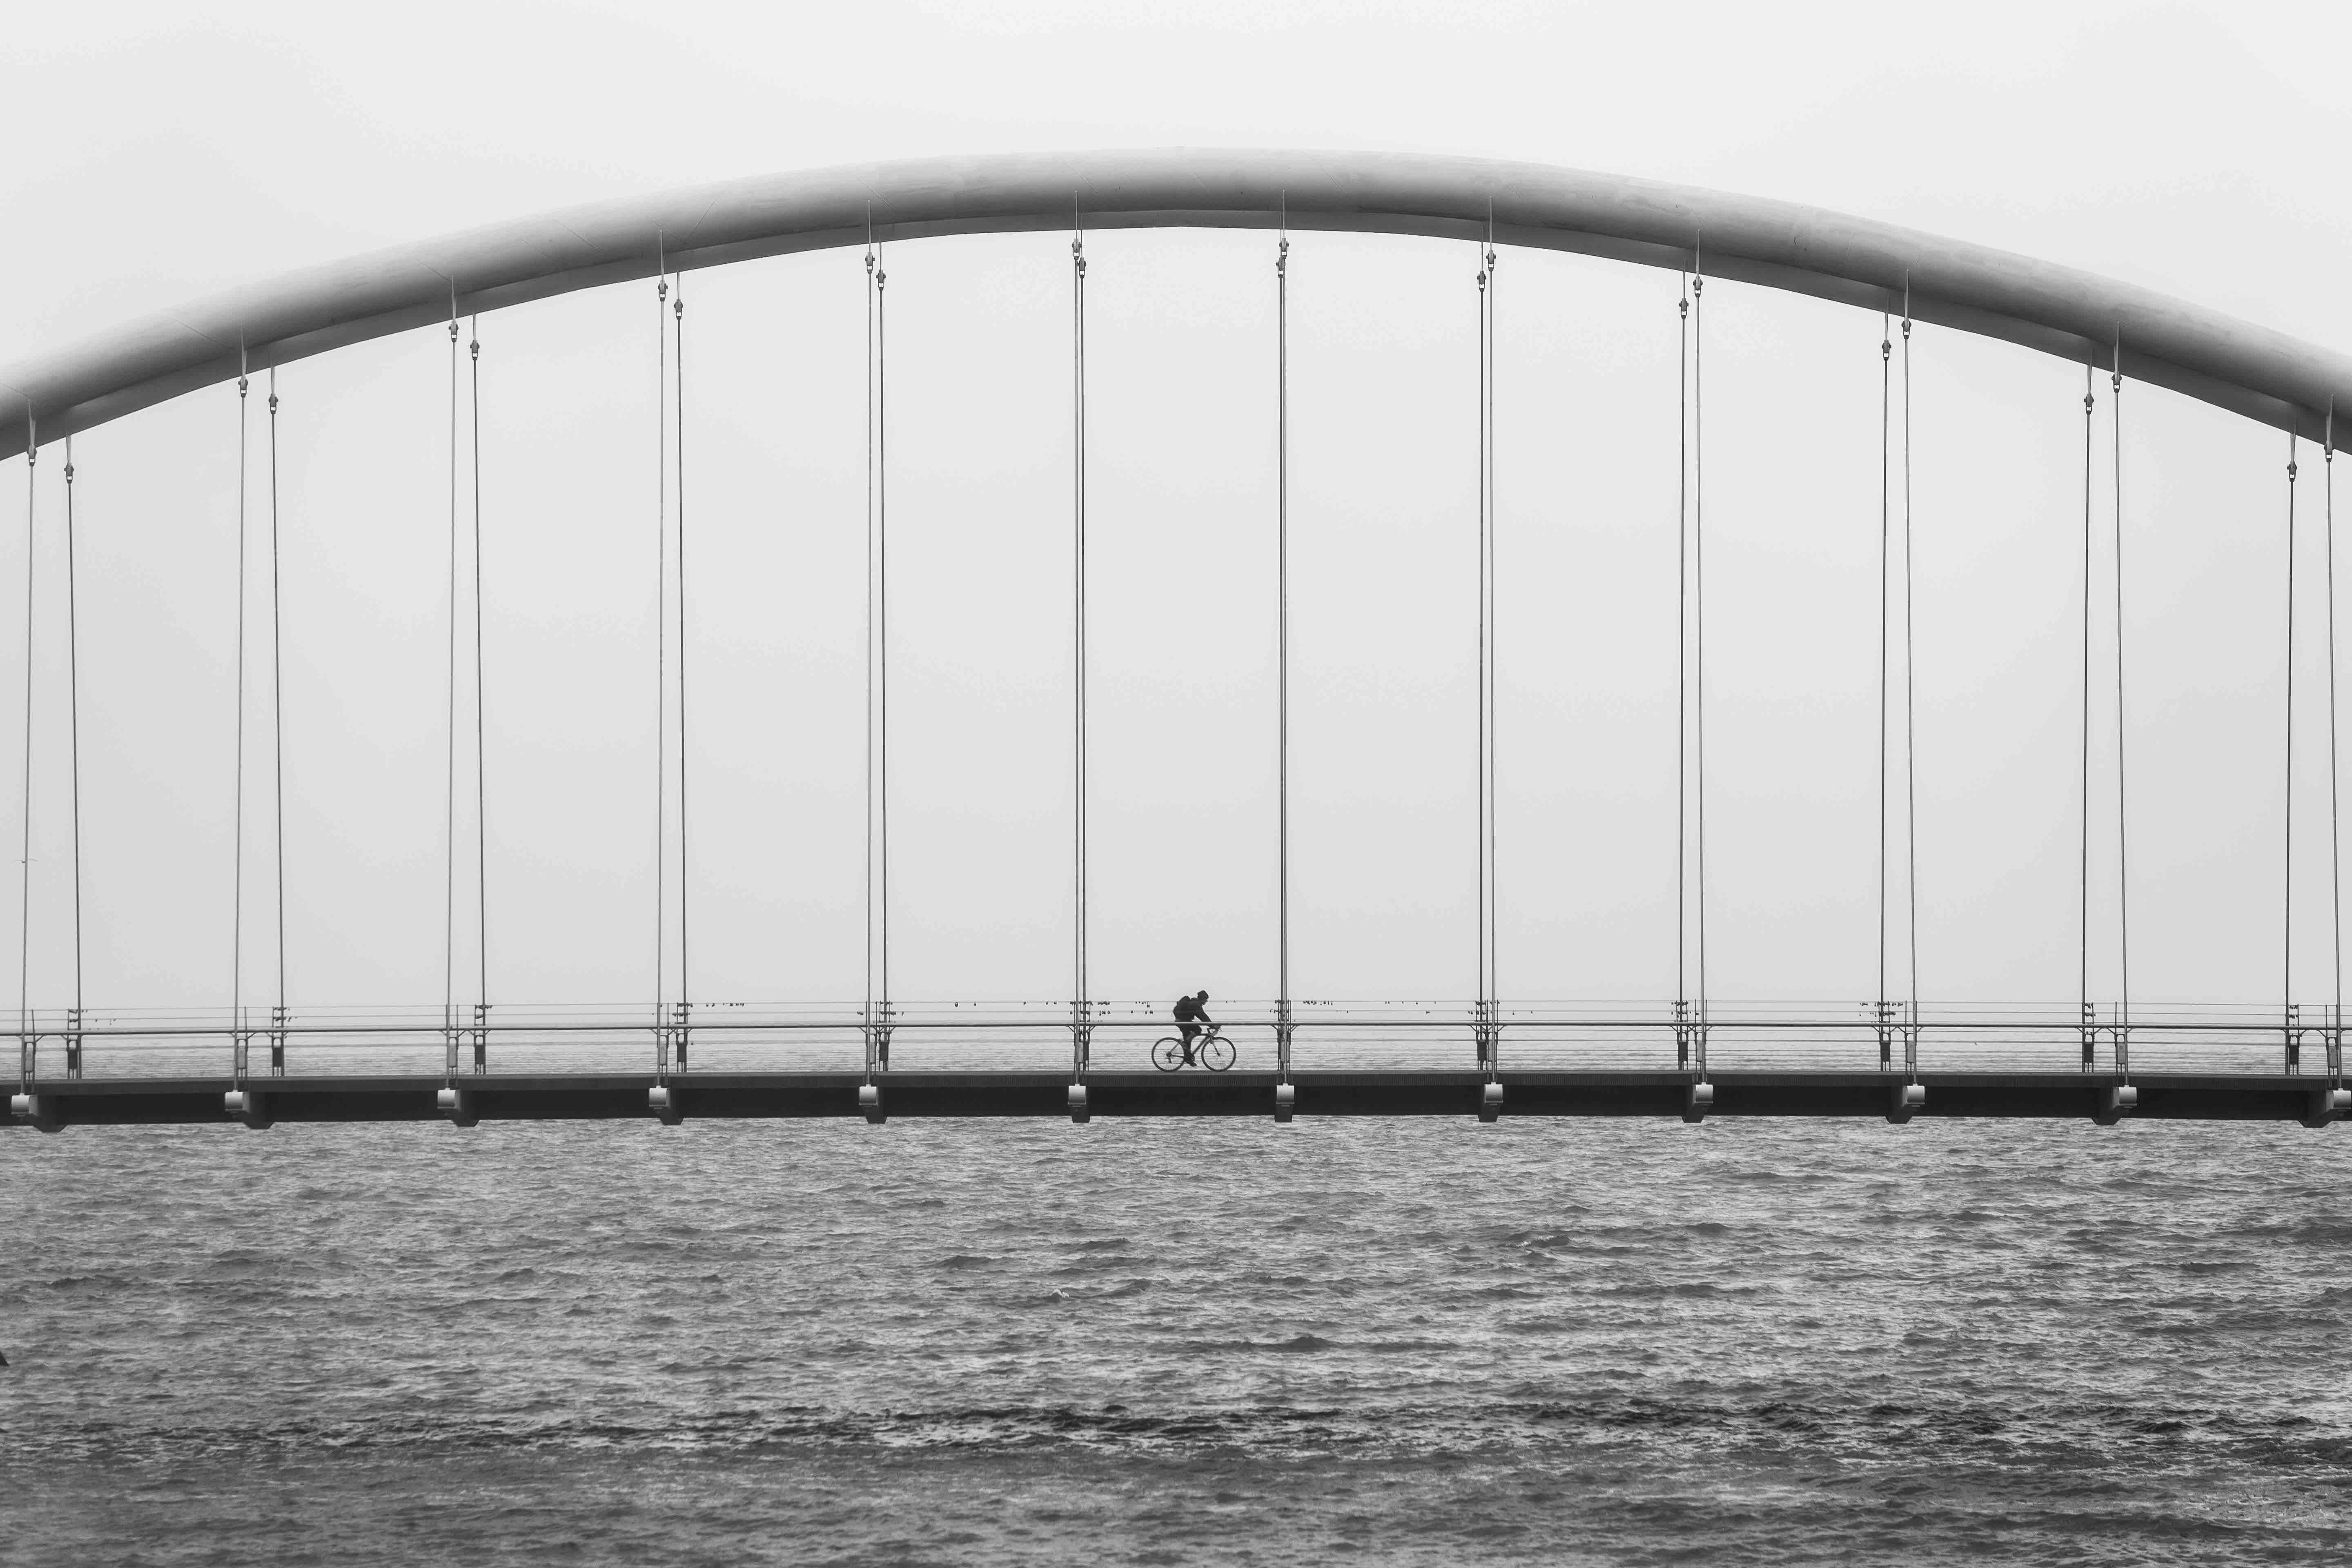
Focus on building a bridge across a river. Less focus on how it is built, and the tools used.
- I became very interested in how we explore our data - exploratory data analysis.
My research:
Design and improve tools for (exploratory) data analysis
EDA: Exploratory Data Analysis
...EDA is an approach to analyzing data sets to summarize their main characteristics, often with visual methods. (Wikipedia)
John Tukey, Frederick Mosteller, Bill Cleveland, Dianne Cook, Heike Hoffman, Rob Hyndman, Hadley Wickham
EDA: Why it's worth it
EDA: Why it's worth it
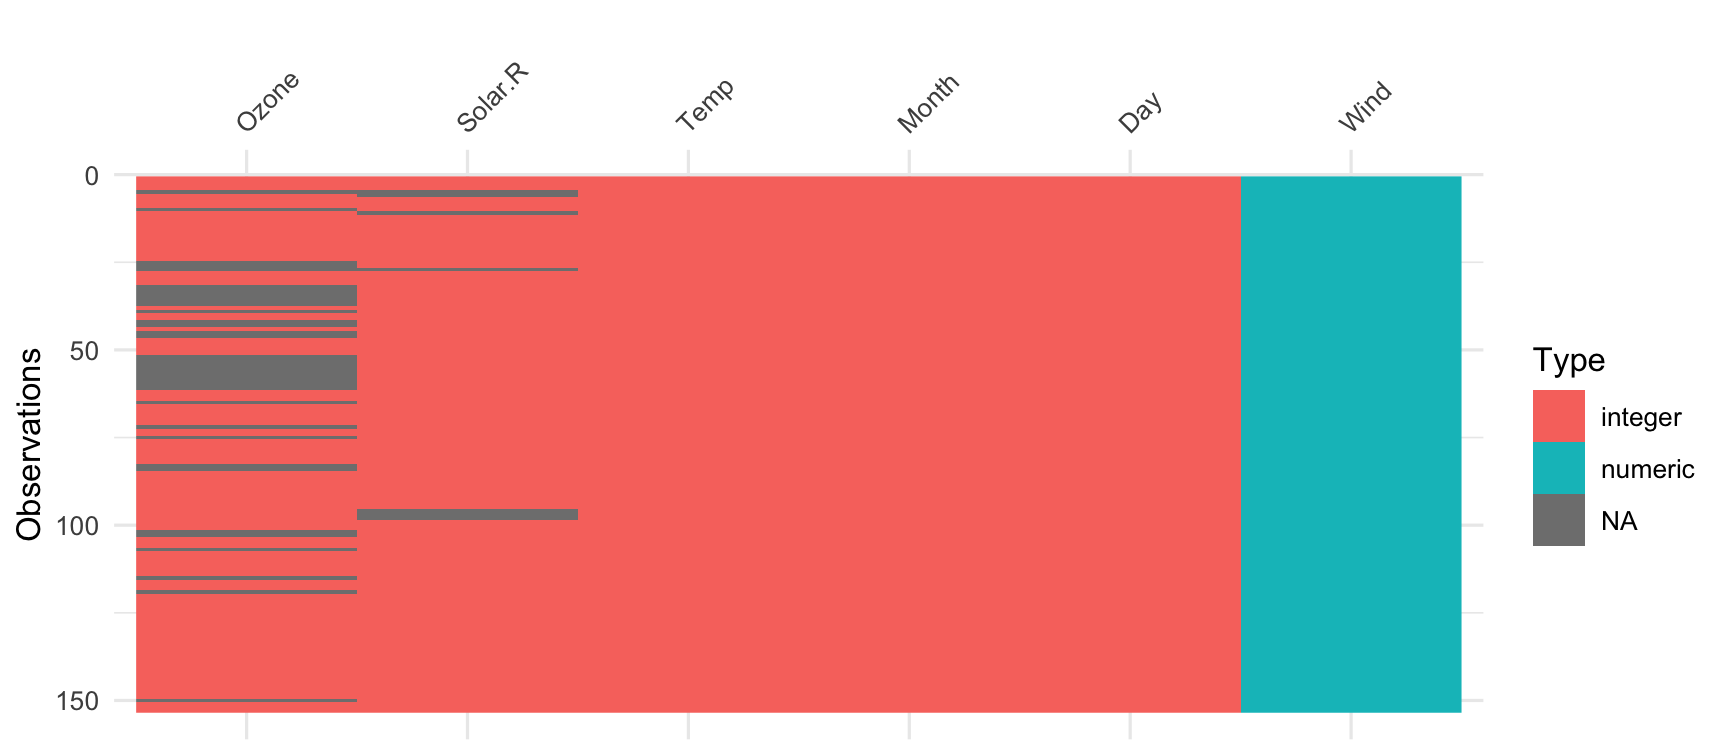
visdat::vis_dat(airquality)
visdat::vis_miss(airquality)
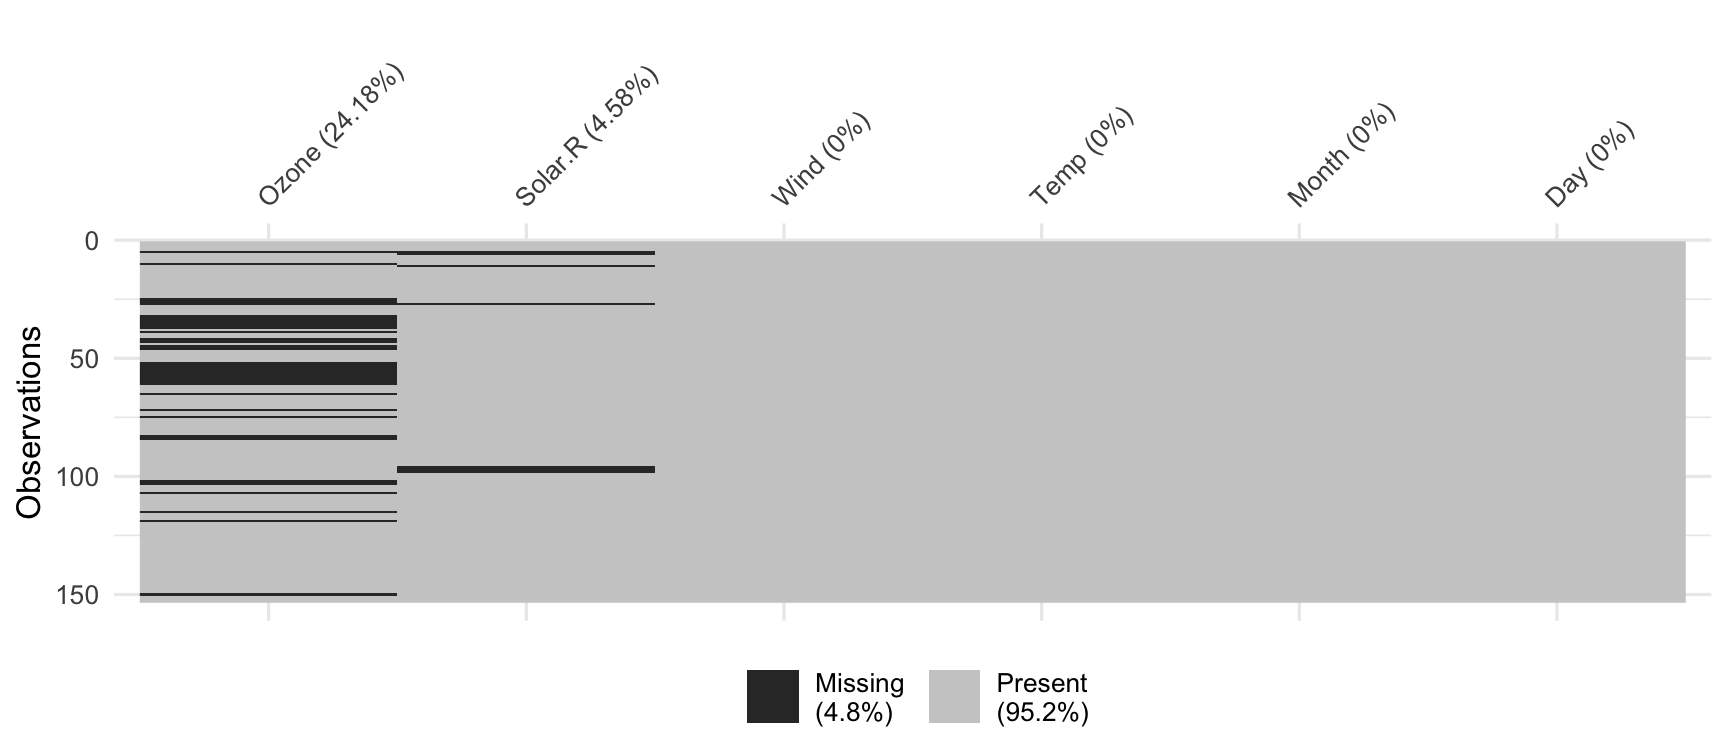
naniar

Tierney, NJ. Cook, D. "Expanding tidy data principles to facilitate missing data exploration, visualization and assessment of imputations." [Pre-print]
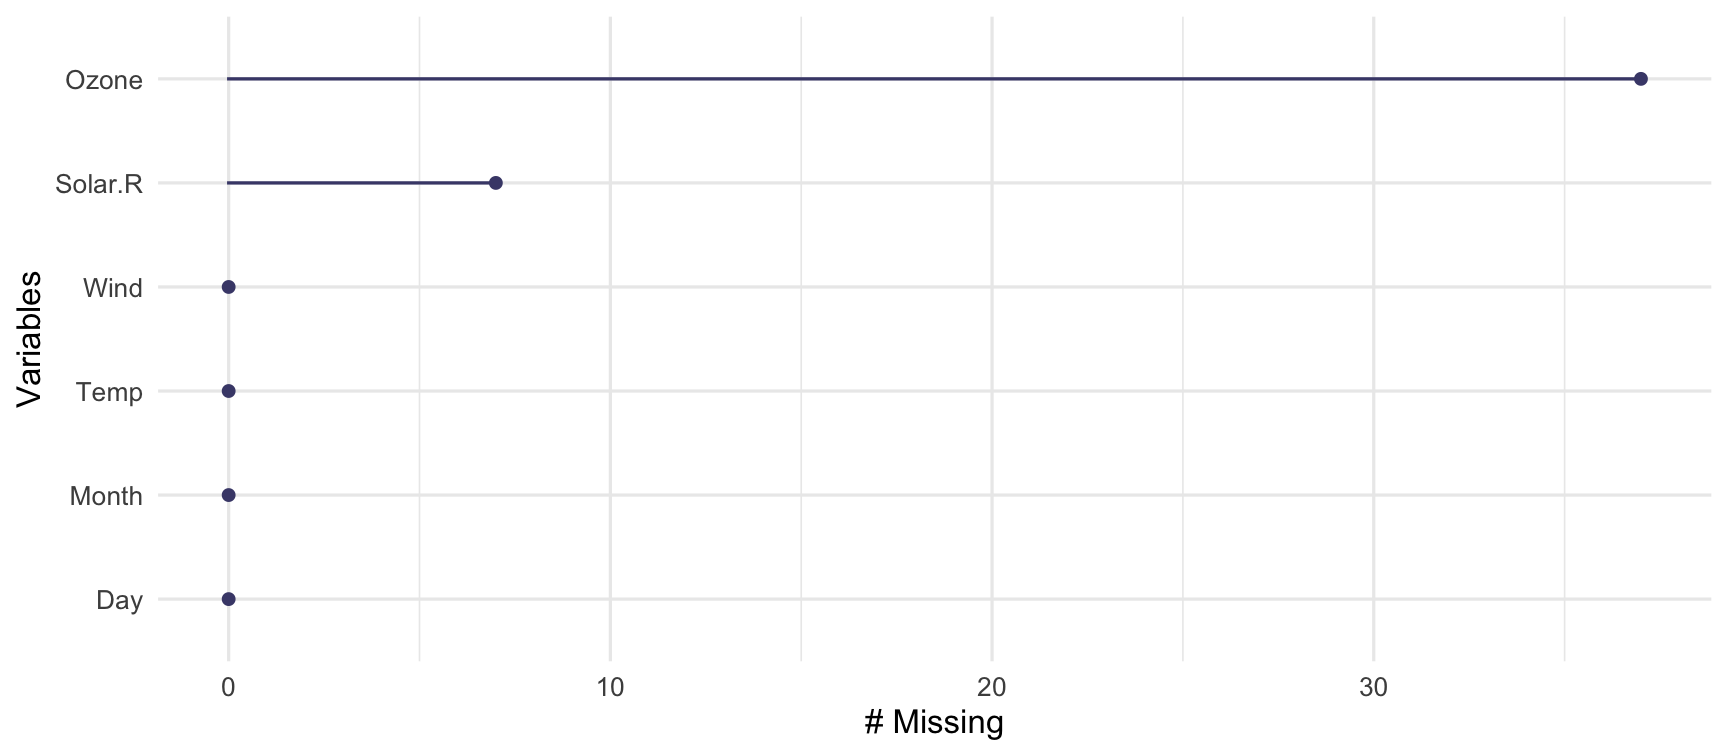
naniar::gg_miss_var(airquality)
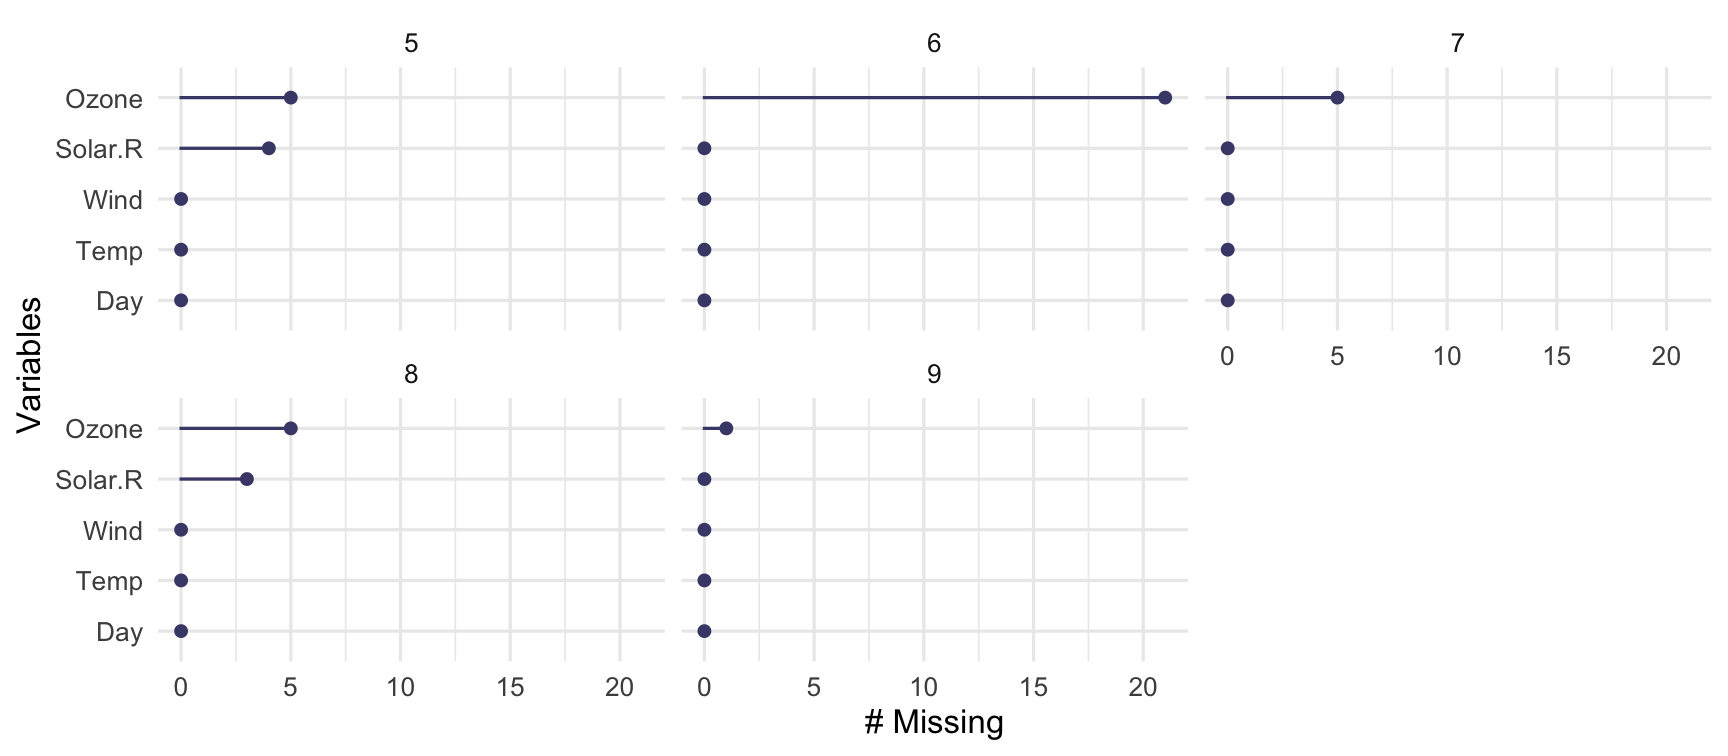
naniar::gg_miss_var(airquality, facet = Month)
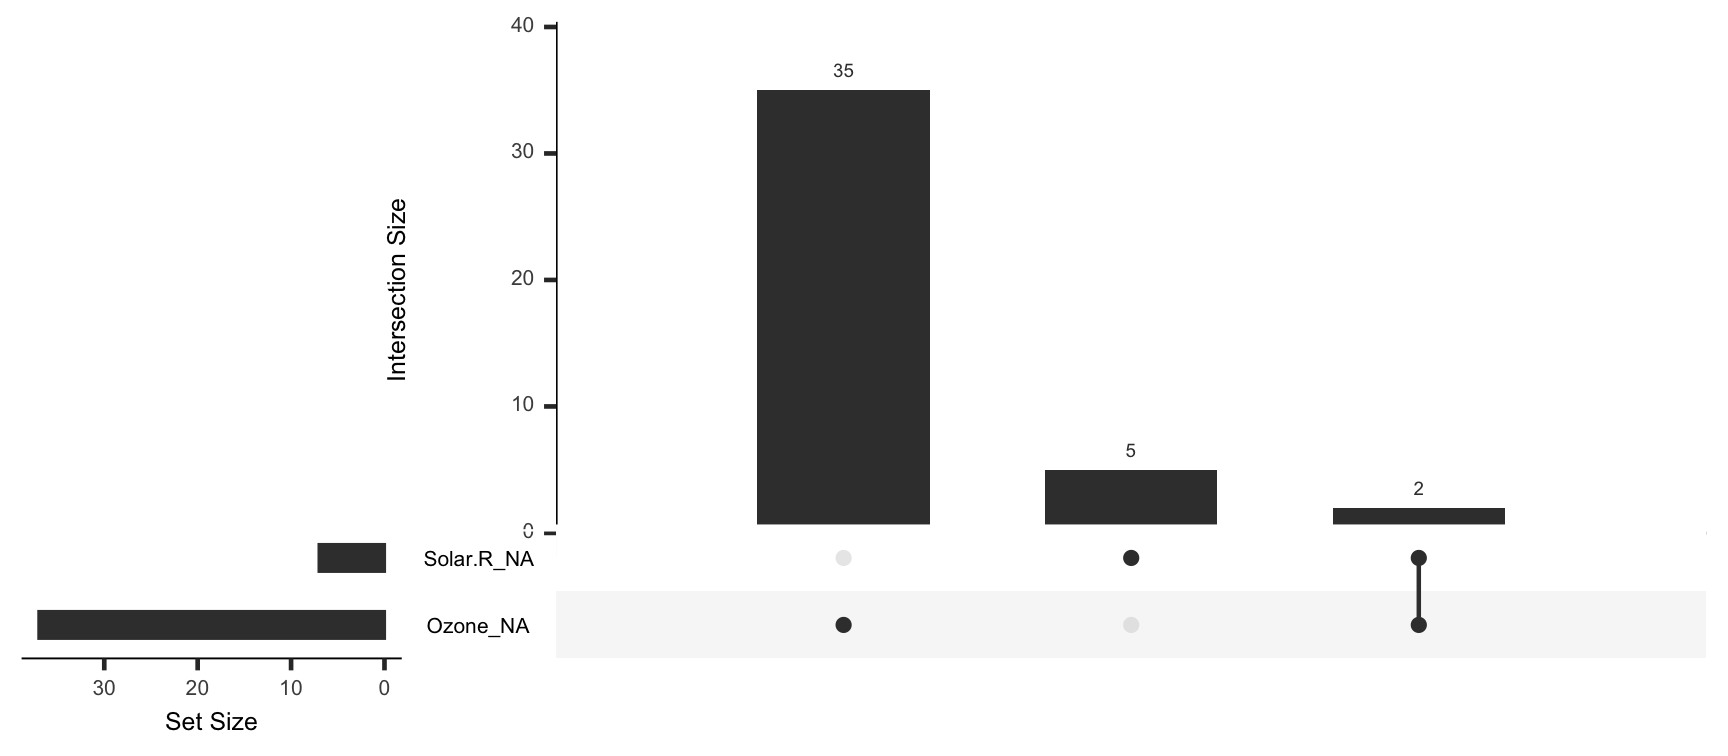
naniar::gg_miss_upset(airquality)
Current work:
How to explore longitudinal data effectively
What is longitudinal data?
Something observed sequentially over time
What is longitudinal data?
| country | year | height_cm |
|---|---|---|
| Australia | 1910 | 172.7 |
What is longitudinal data?
| country | year | height_cm |
|---|---|---|
| Australia | 1910 | 172.700 |
| Australia | 1920 | 172.846 |
What is longitudinal data?
| country | year | height_cm |
|---|---|---|
| Australia | 1910 | 172.700 |
| Australia | 1920 | 172.846 |
| Australia | 1960 | 176.300 |
What is longitudinal data?
| country | year | height_cm |
|---|---|---|
| Australia | 1910 | 172.700 |
| Australia | 1920 | 172.846 |
| Australia | 1960 | 176.300 |
| Australia | 1970 | 178.400 |
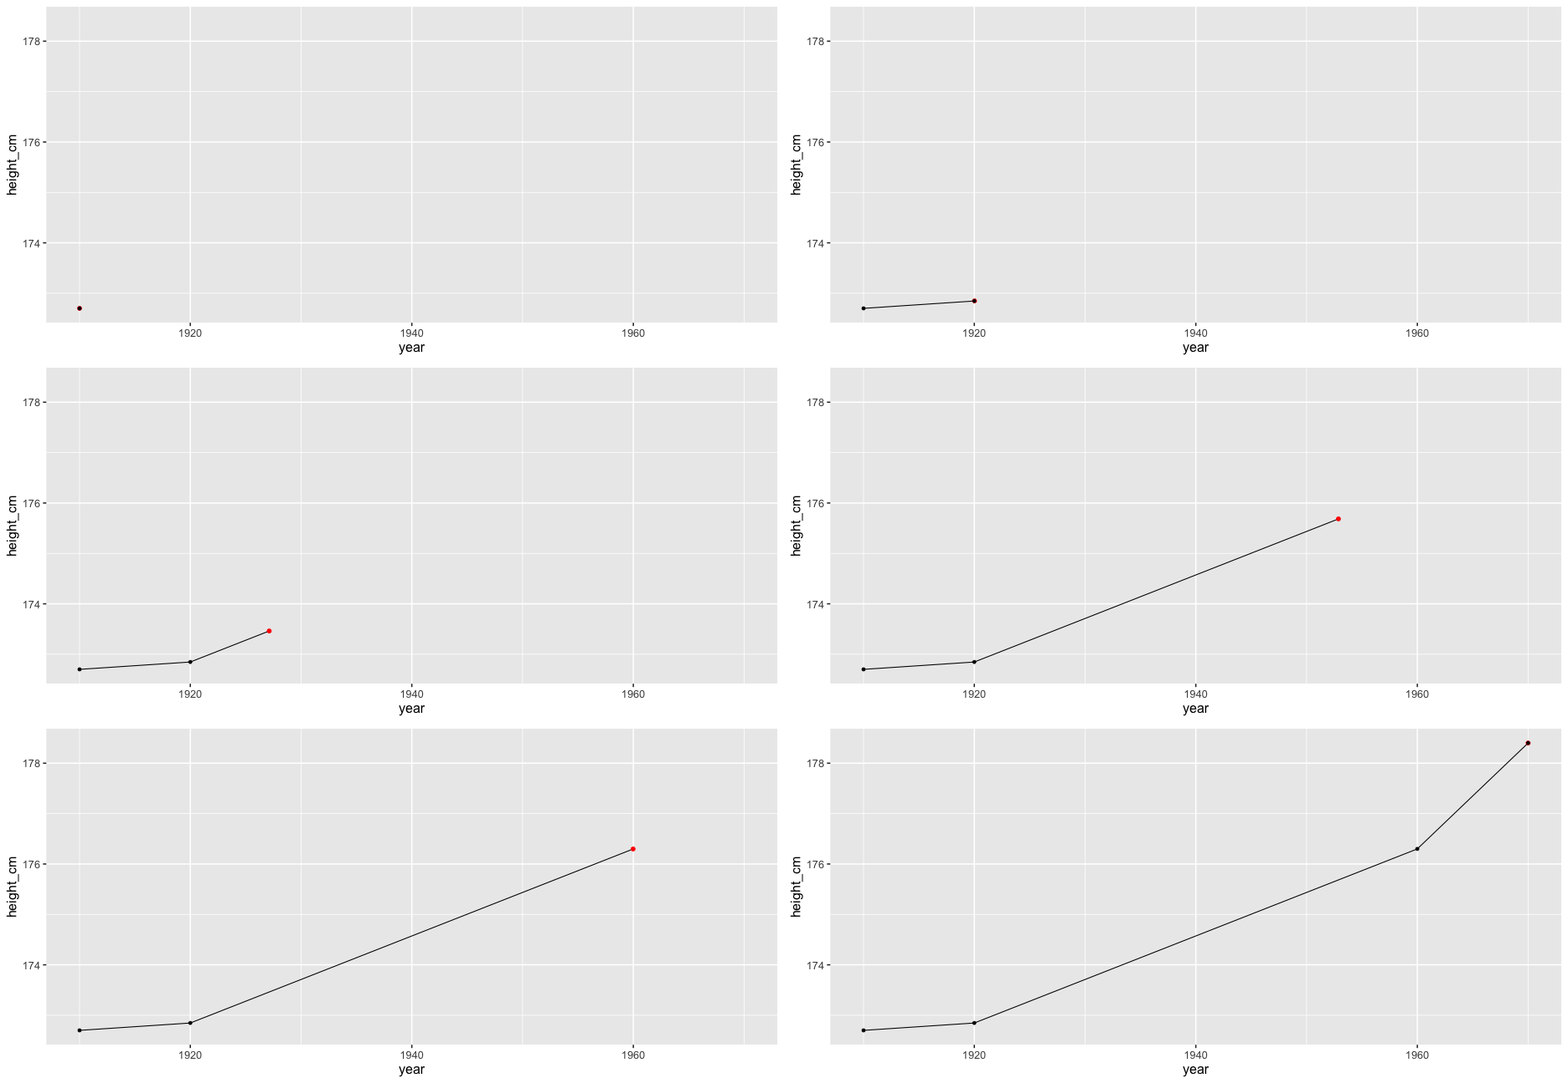
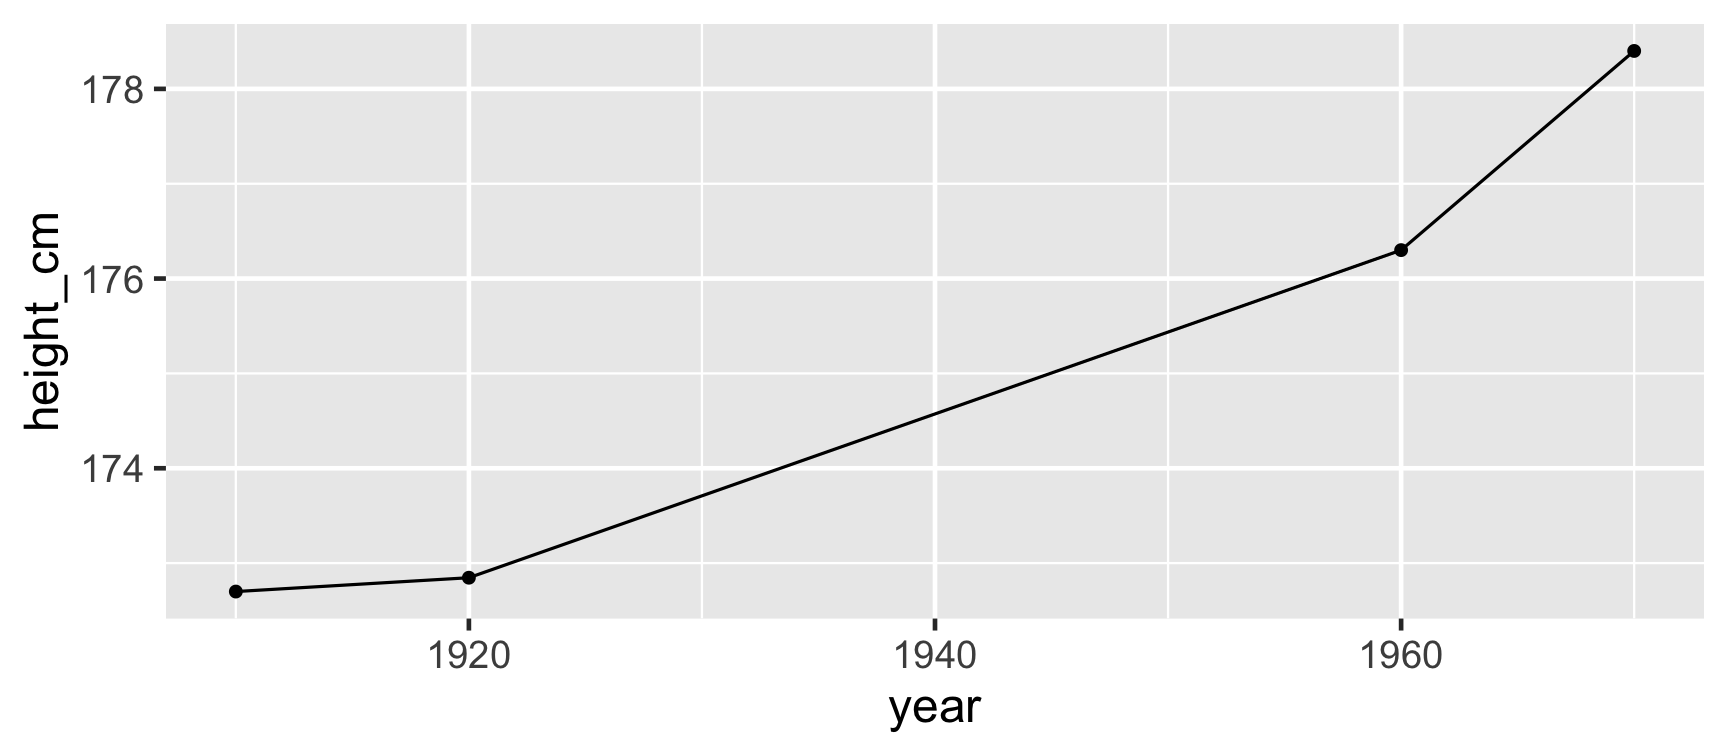
All of Australia
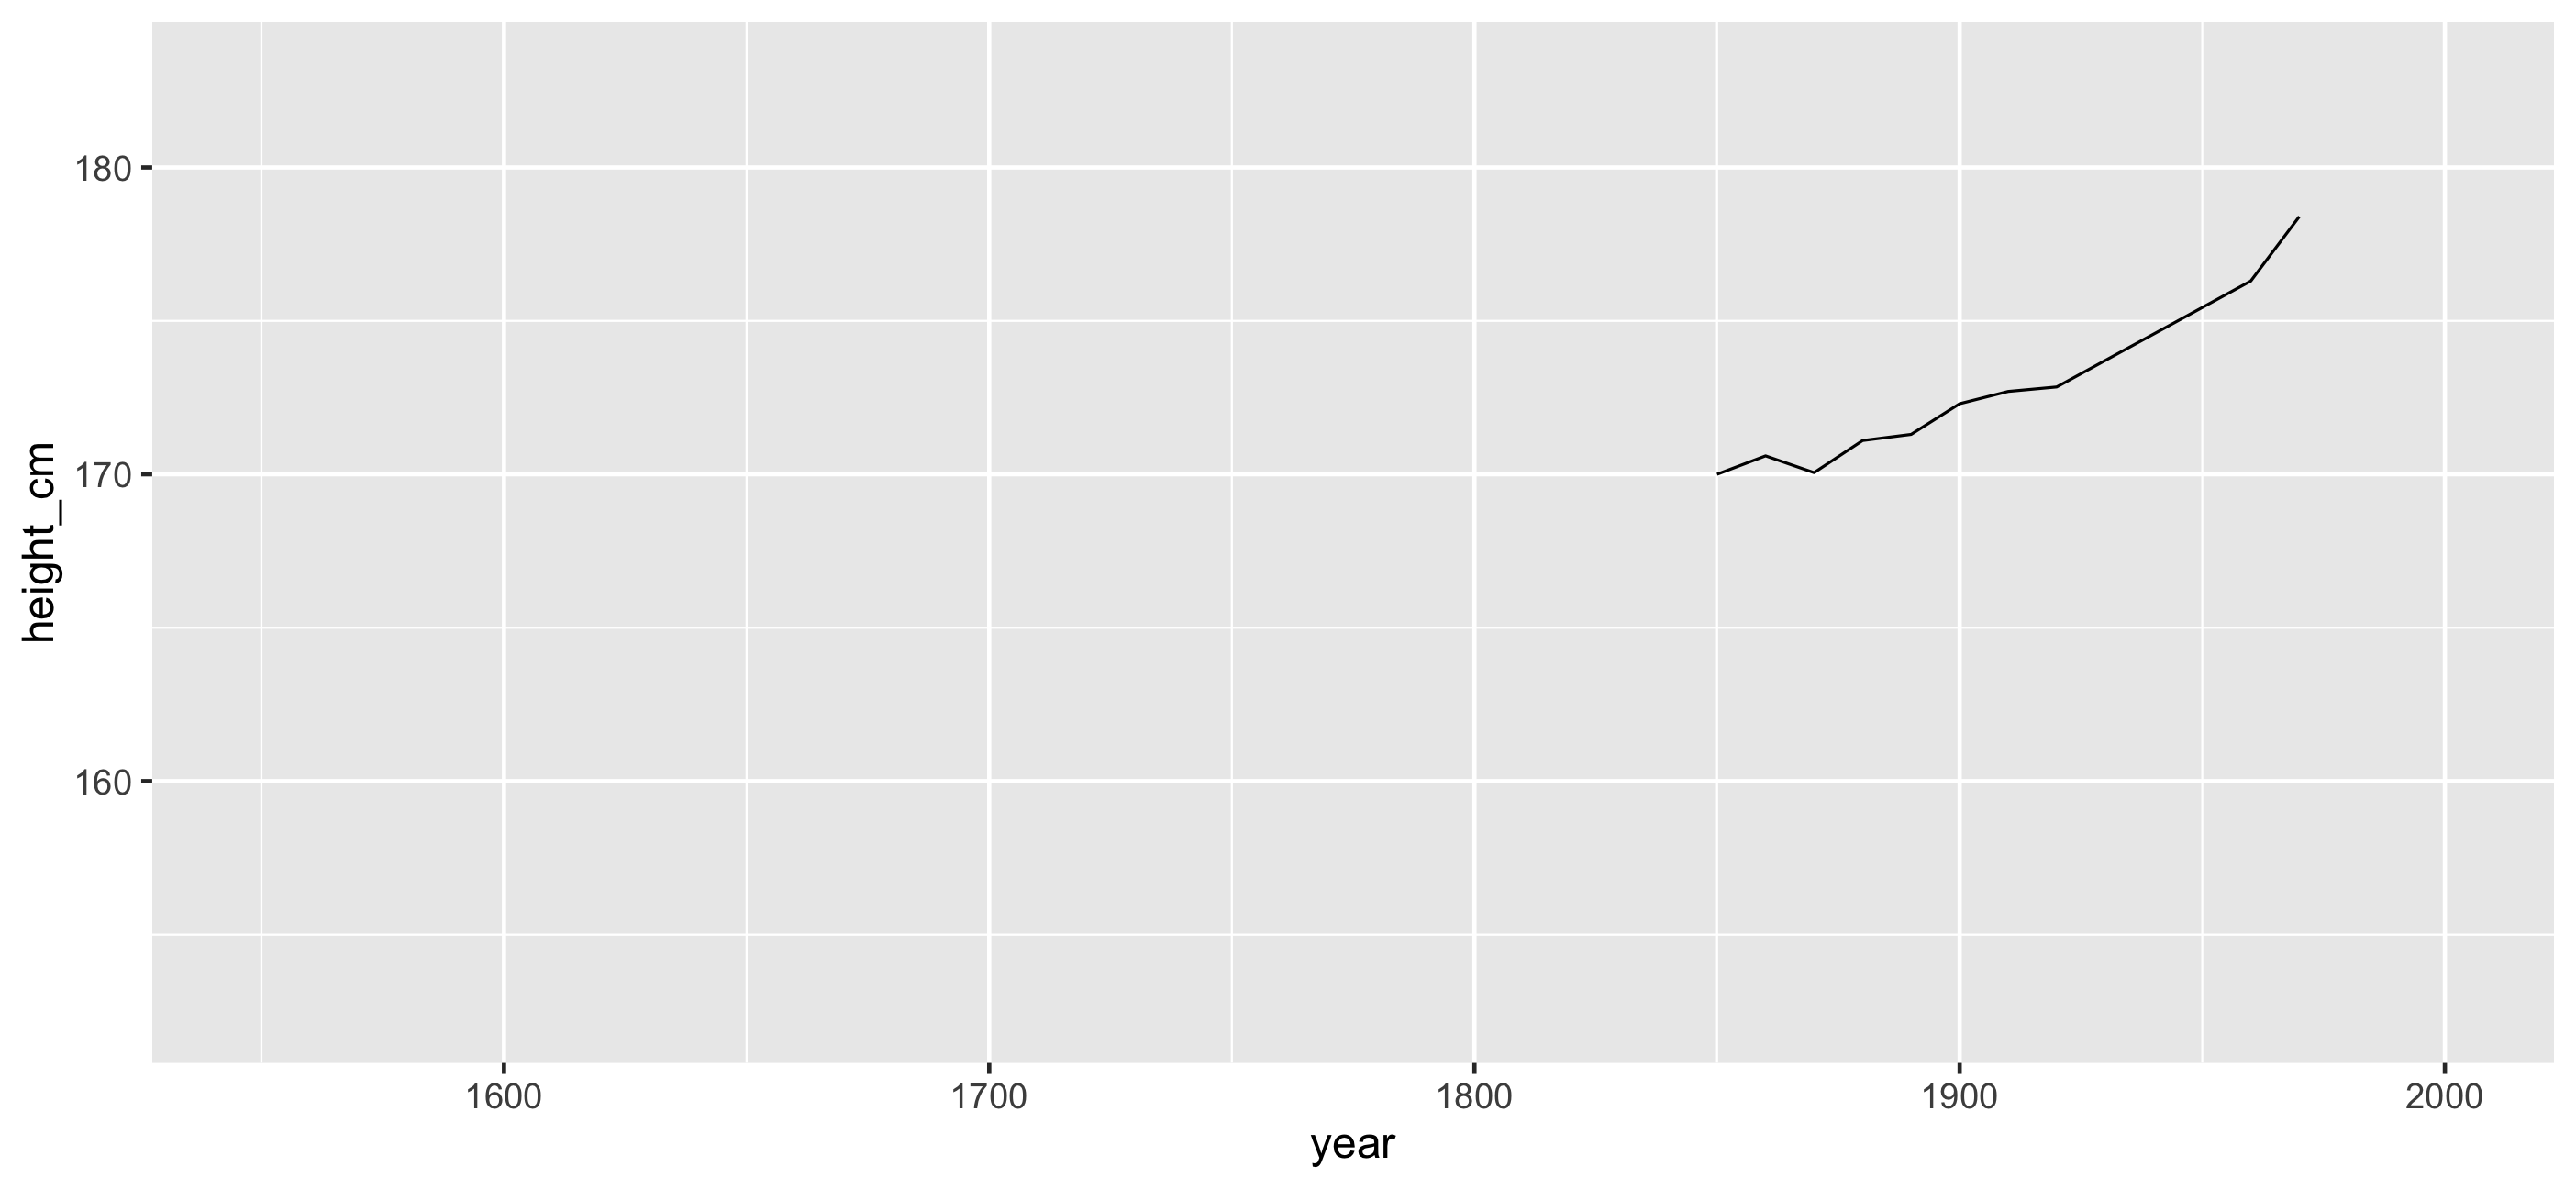
...And New Zealand
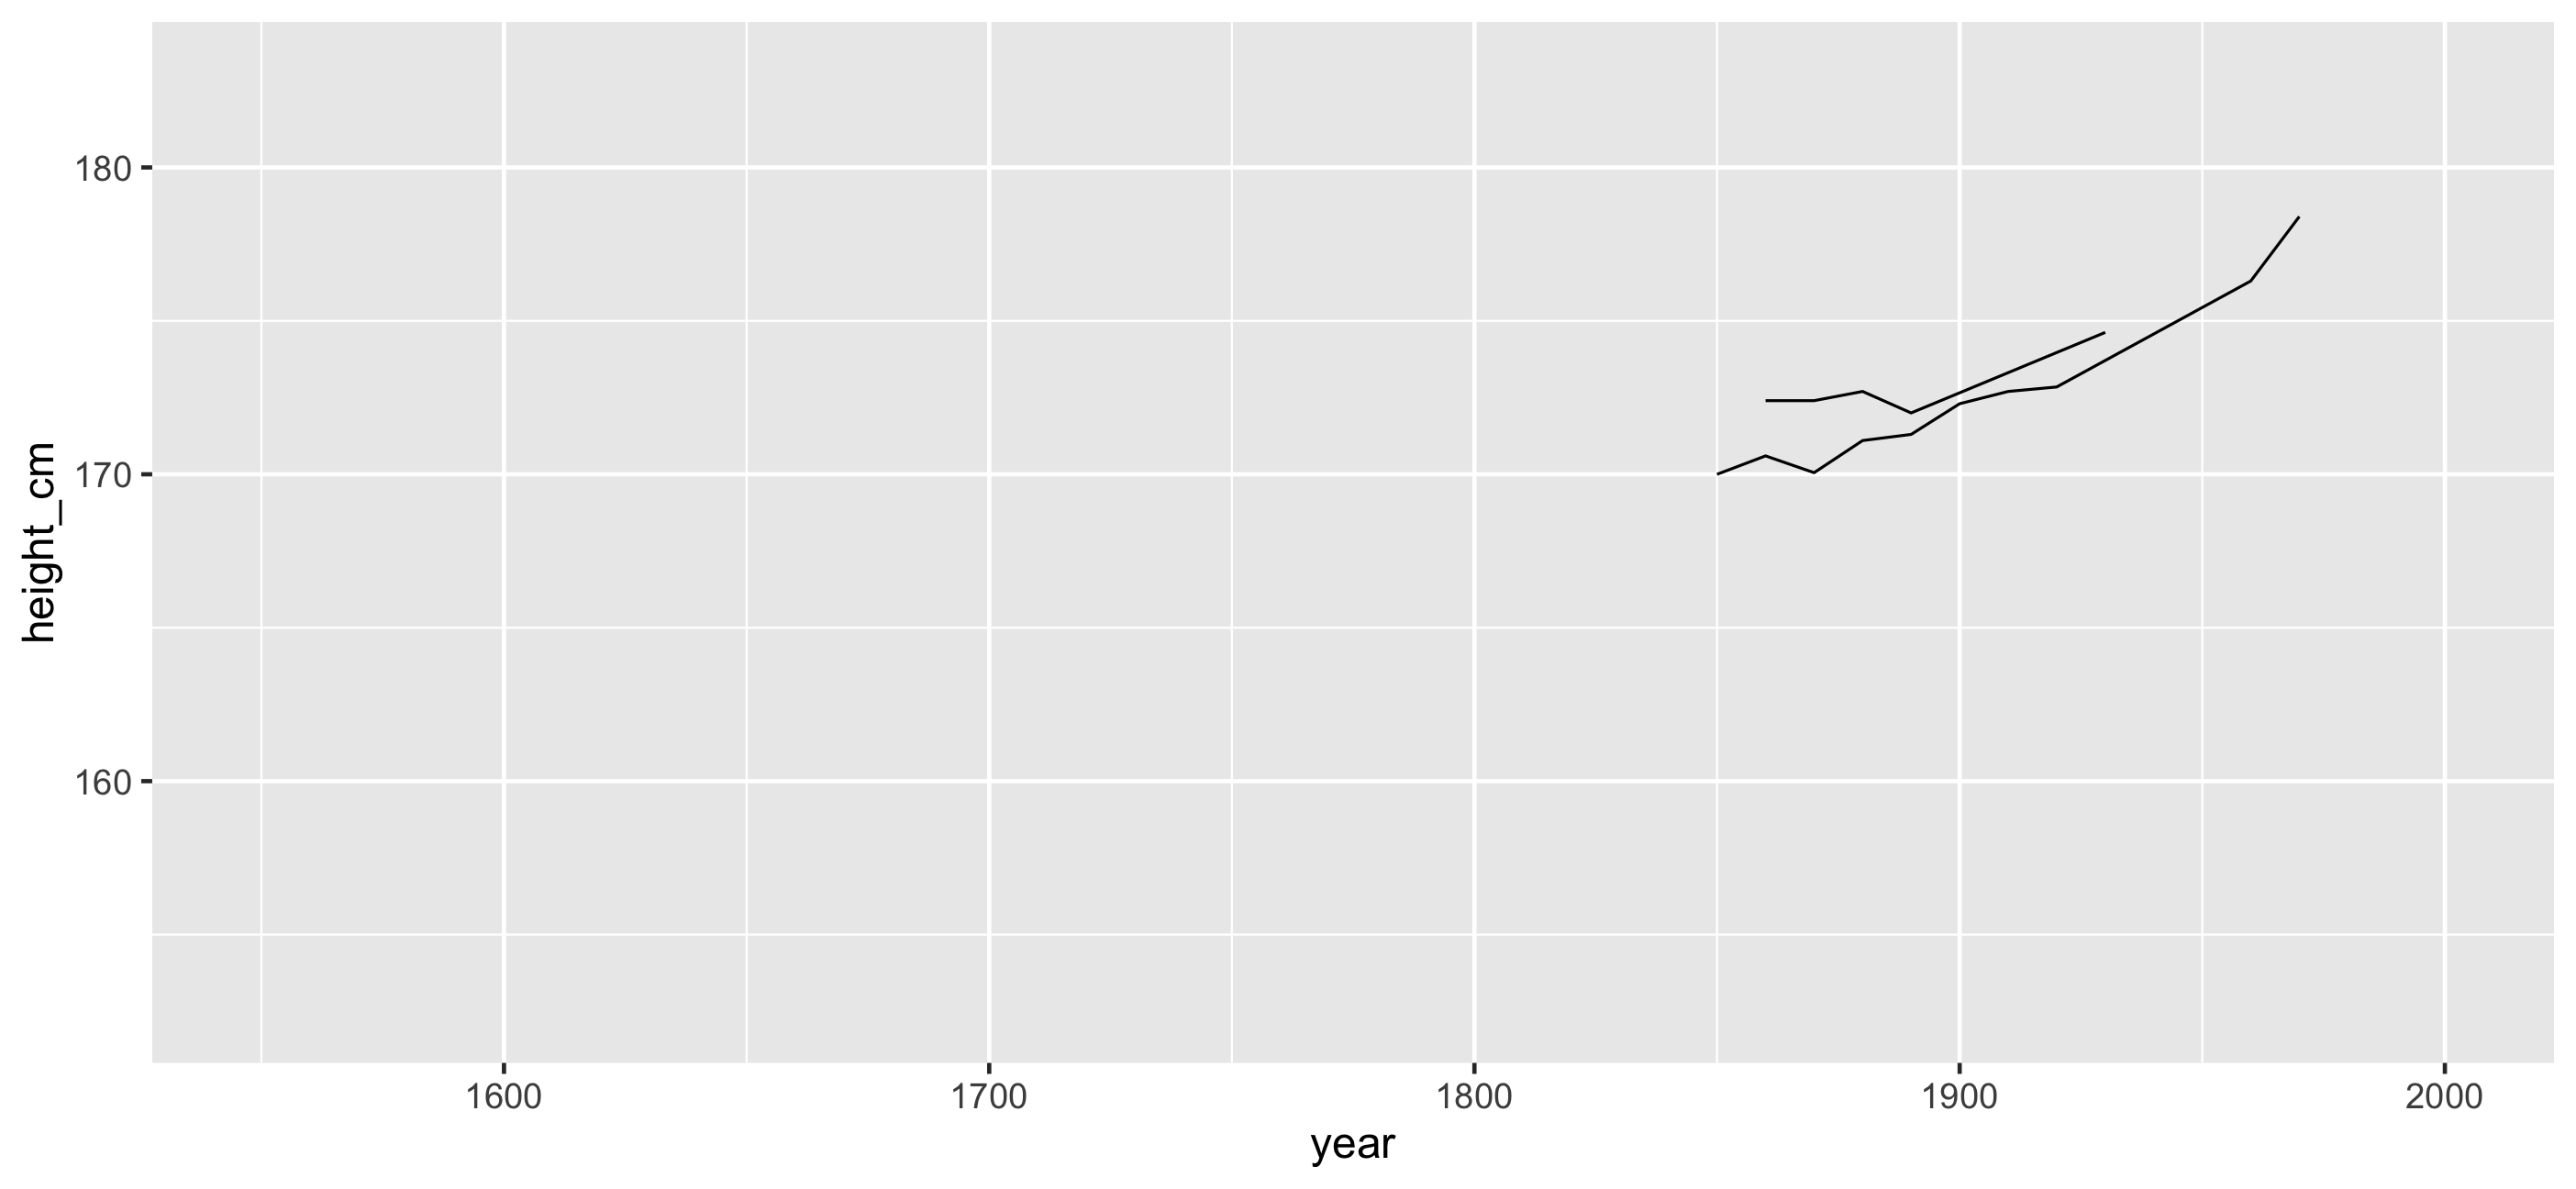
... And Afghanistan and Albania
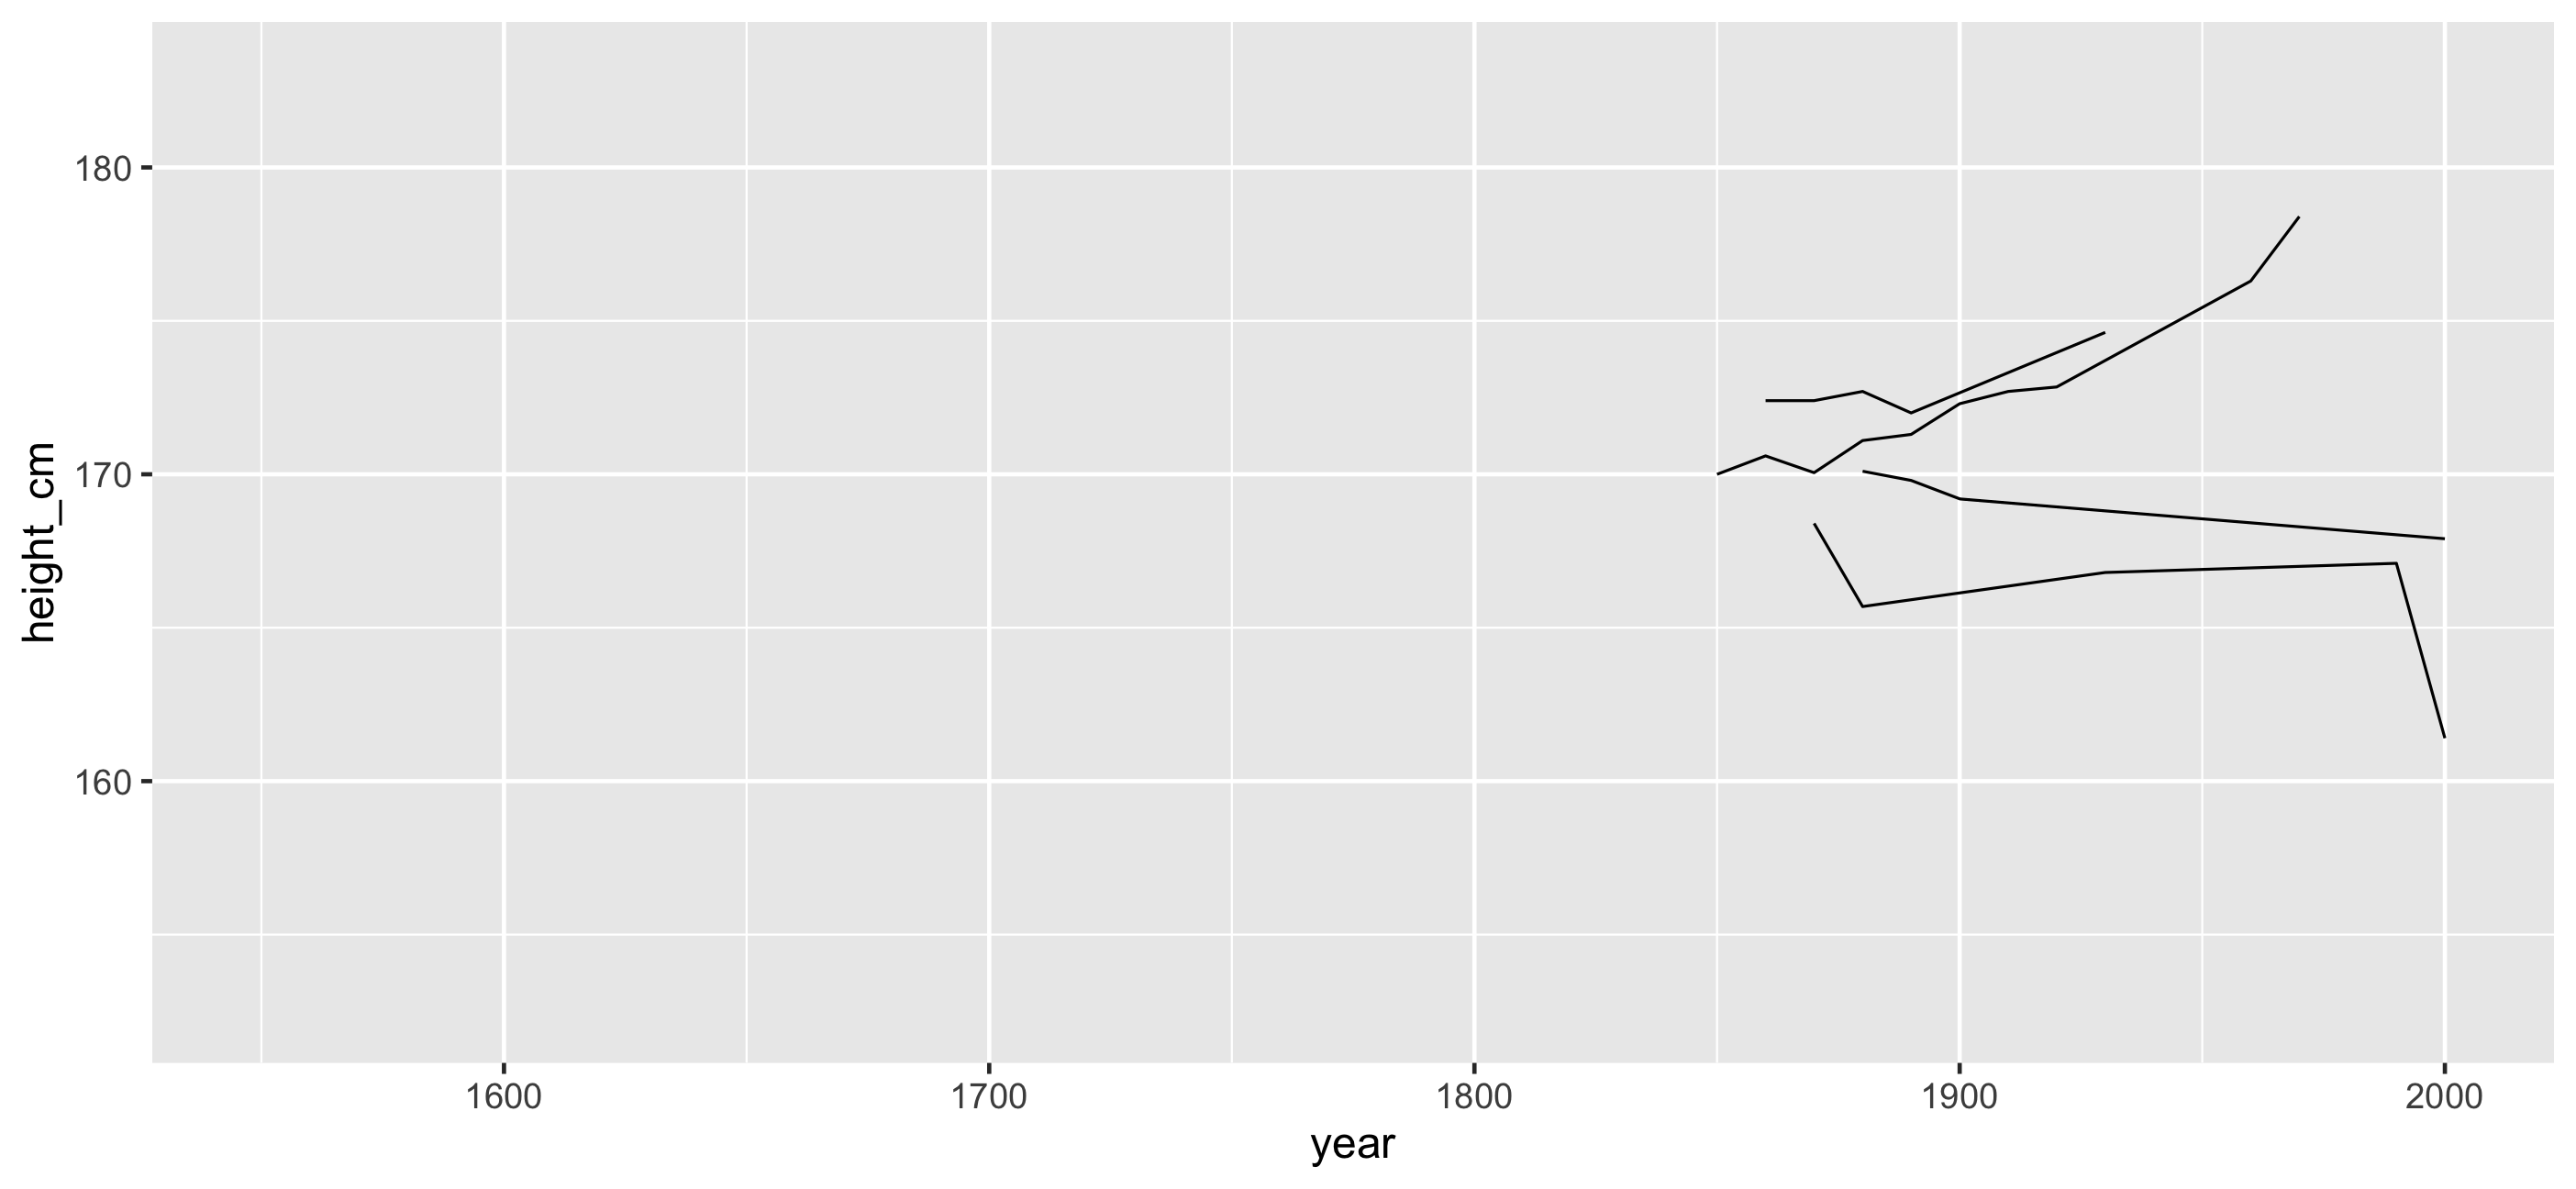
And the rest?
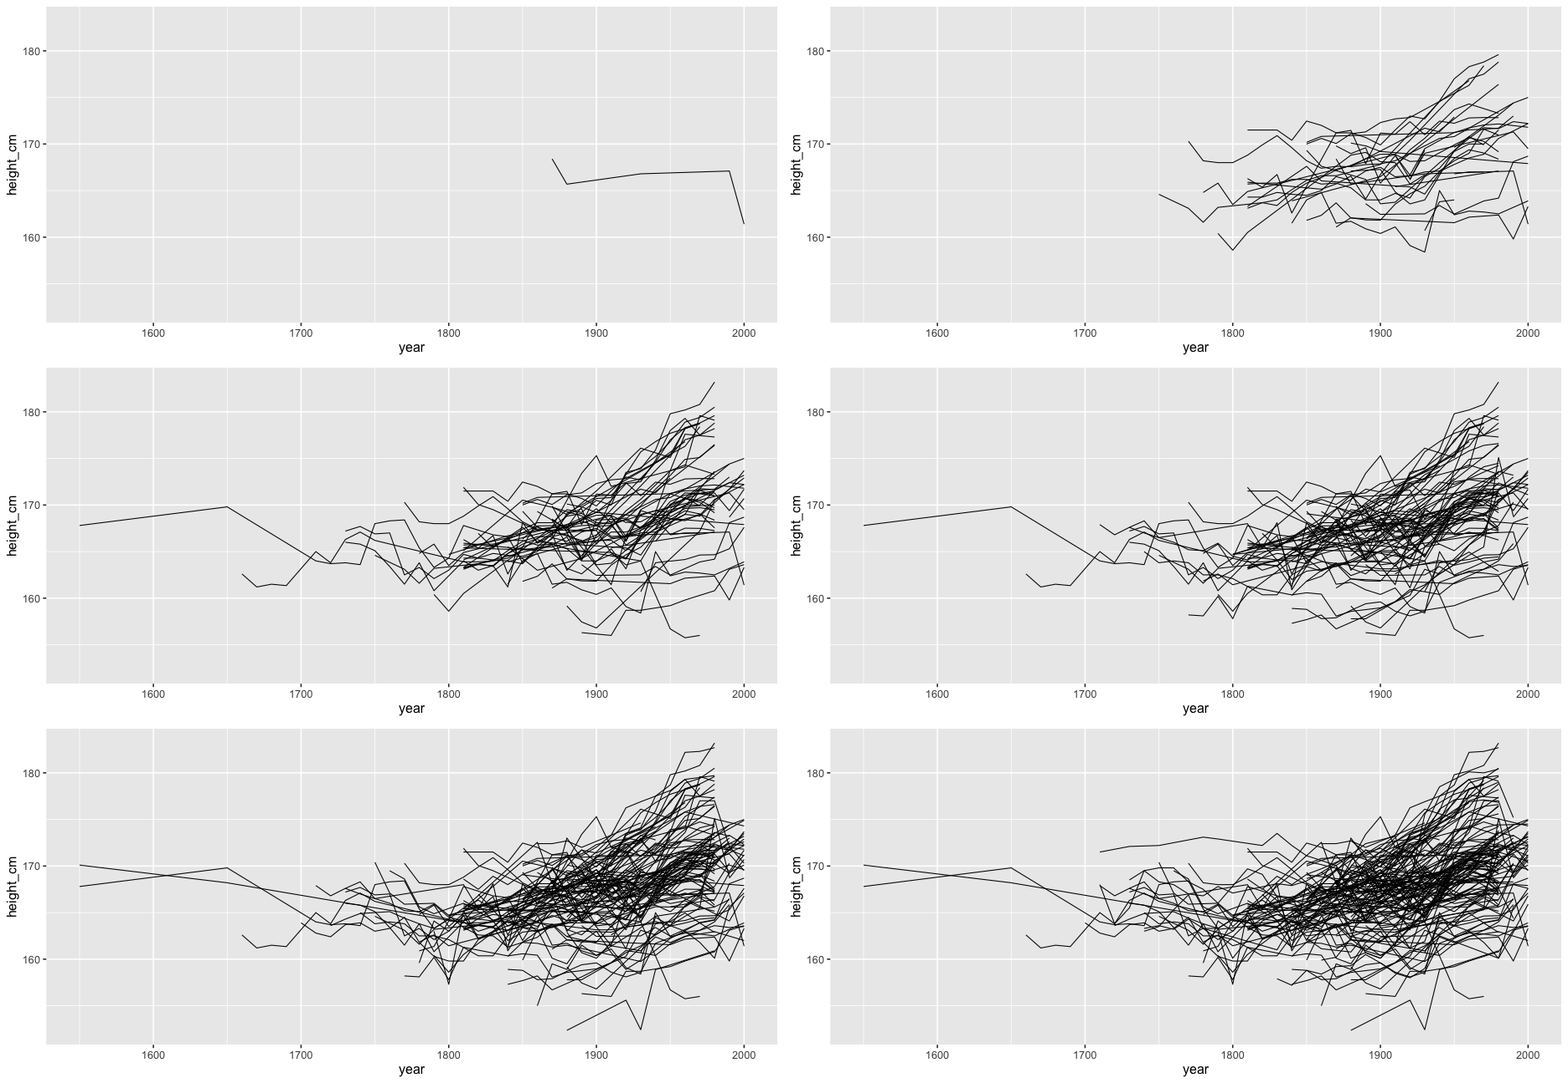
And the rest?
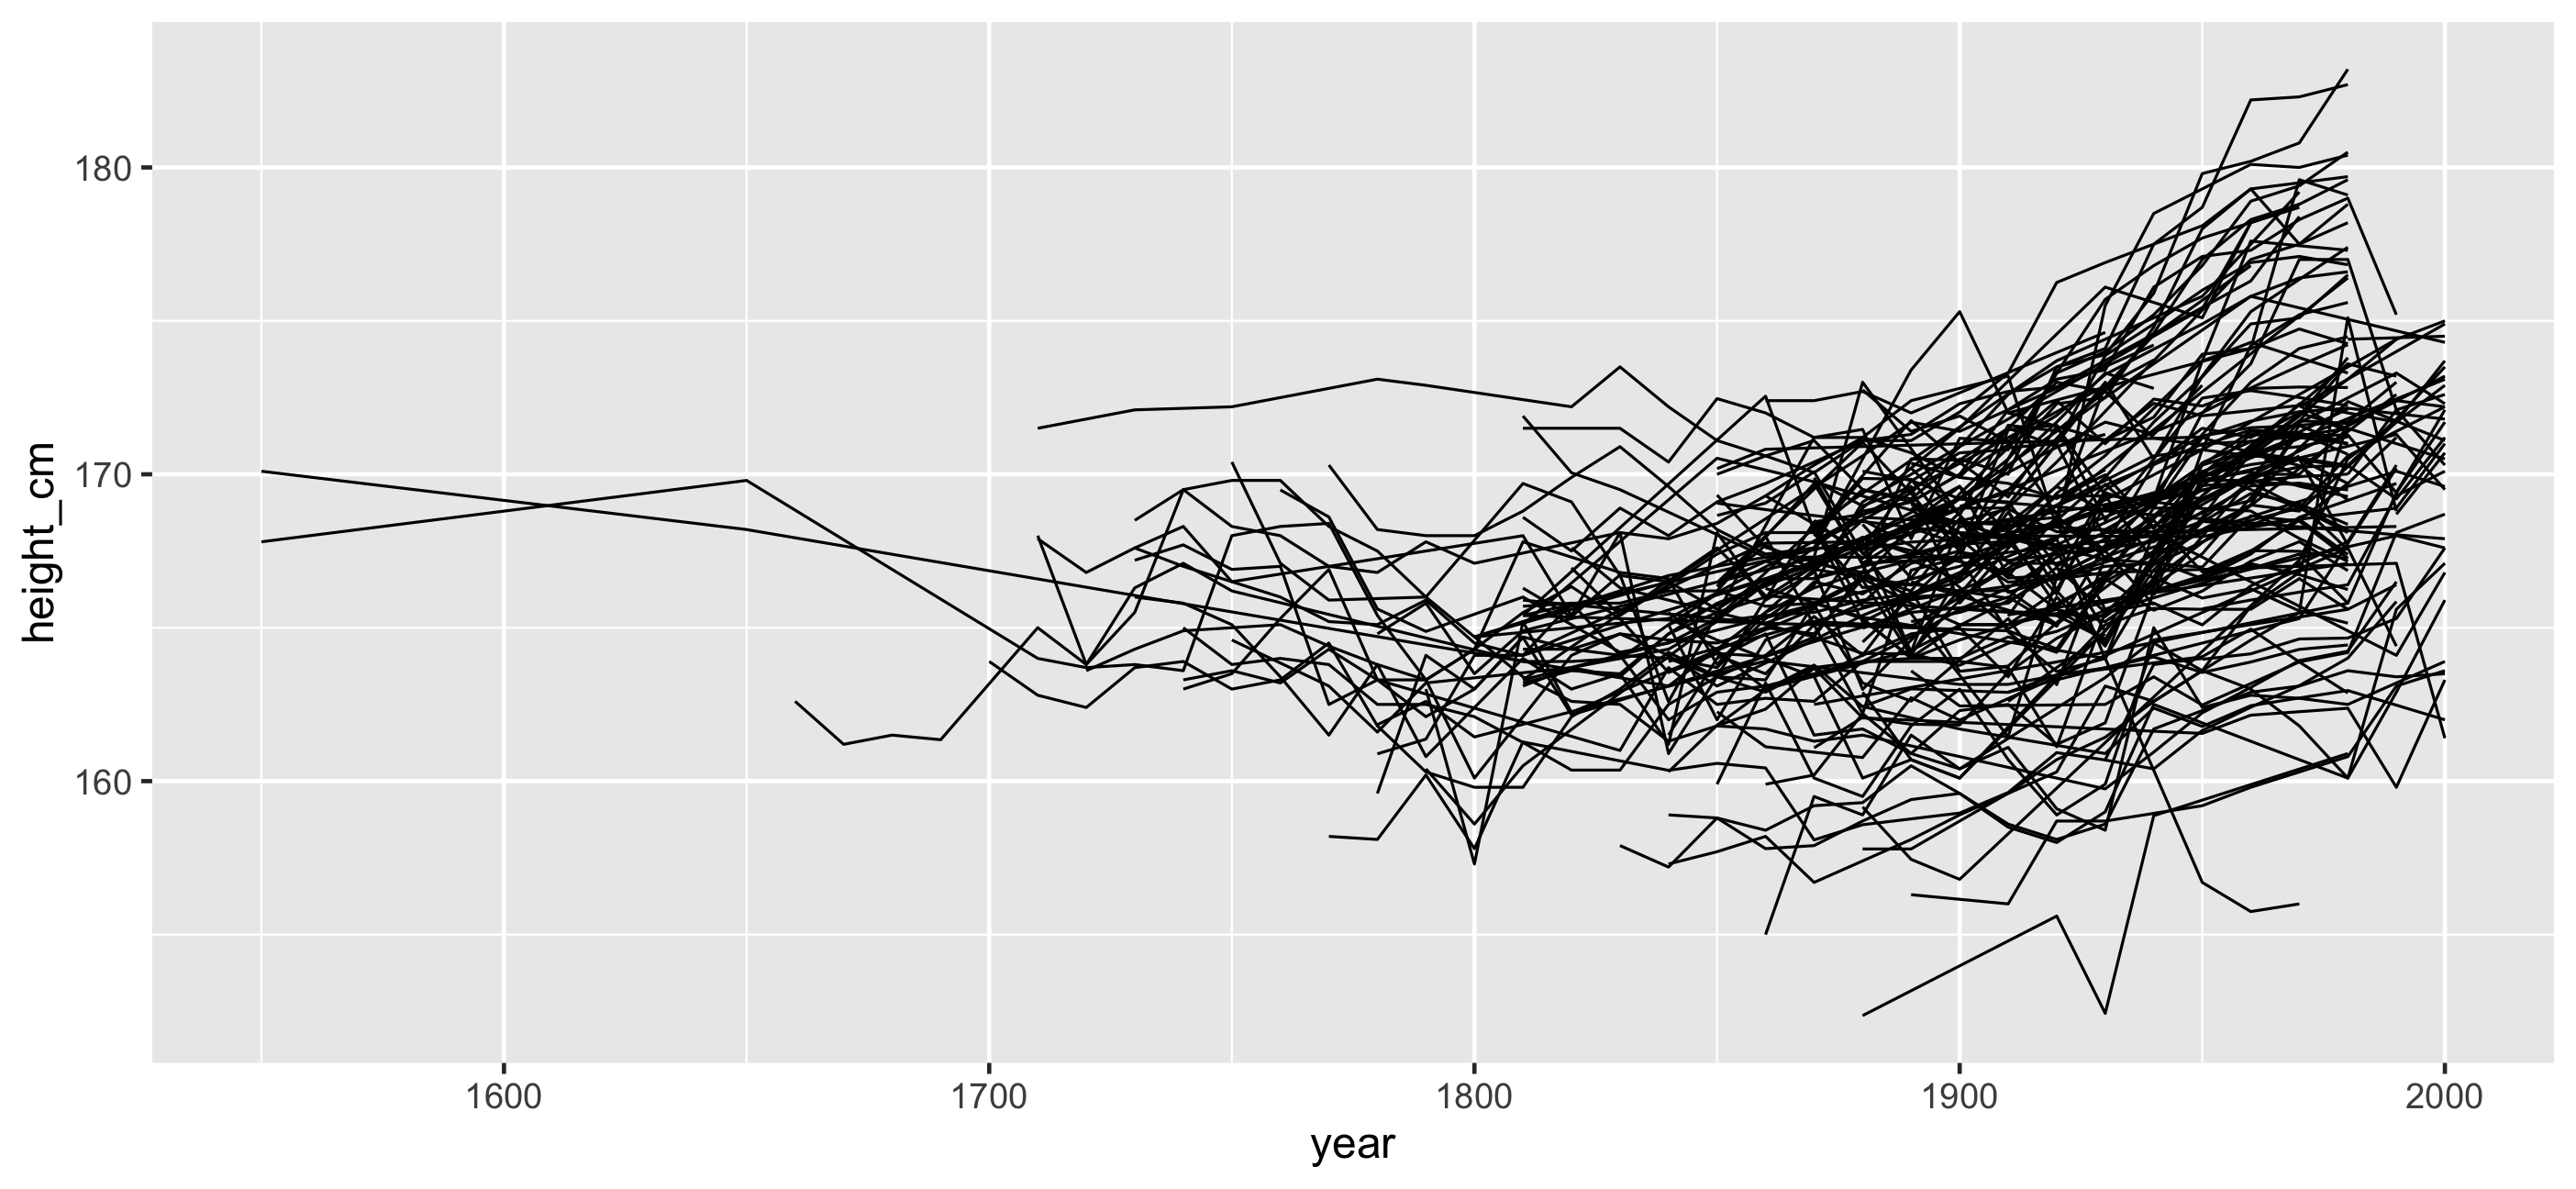

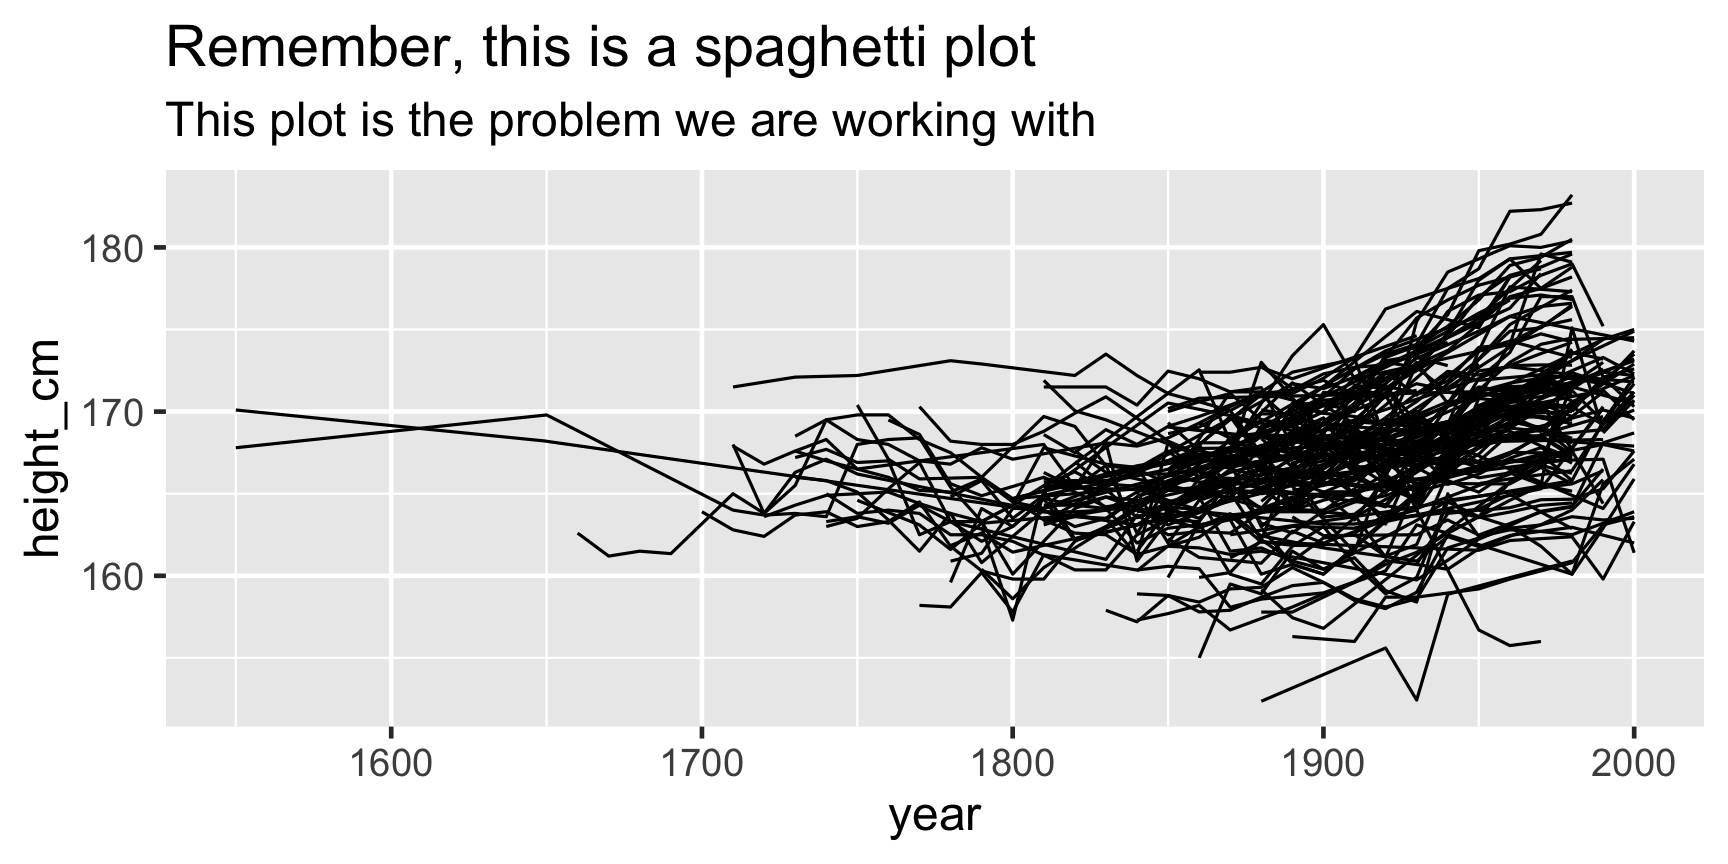
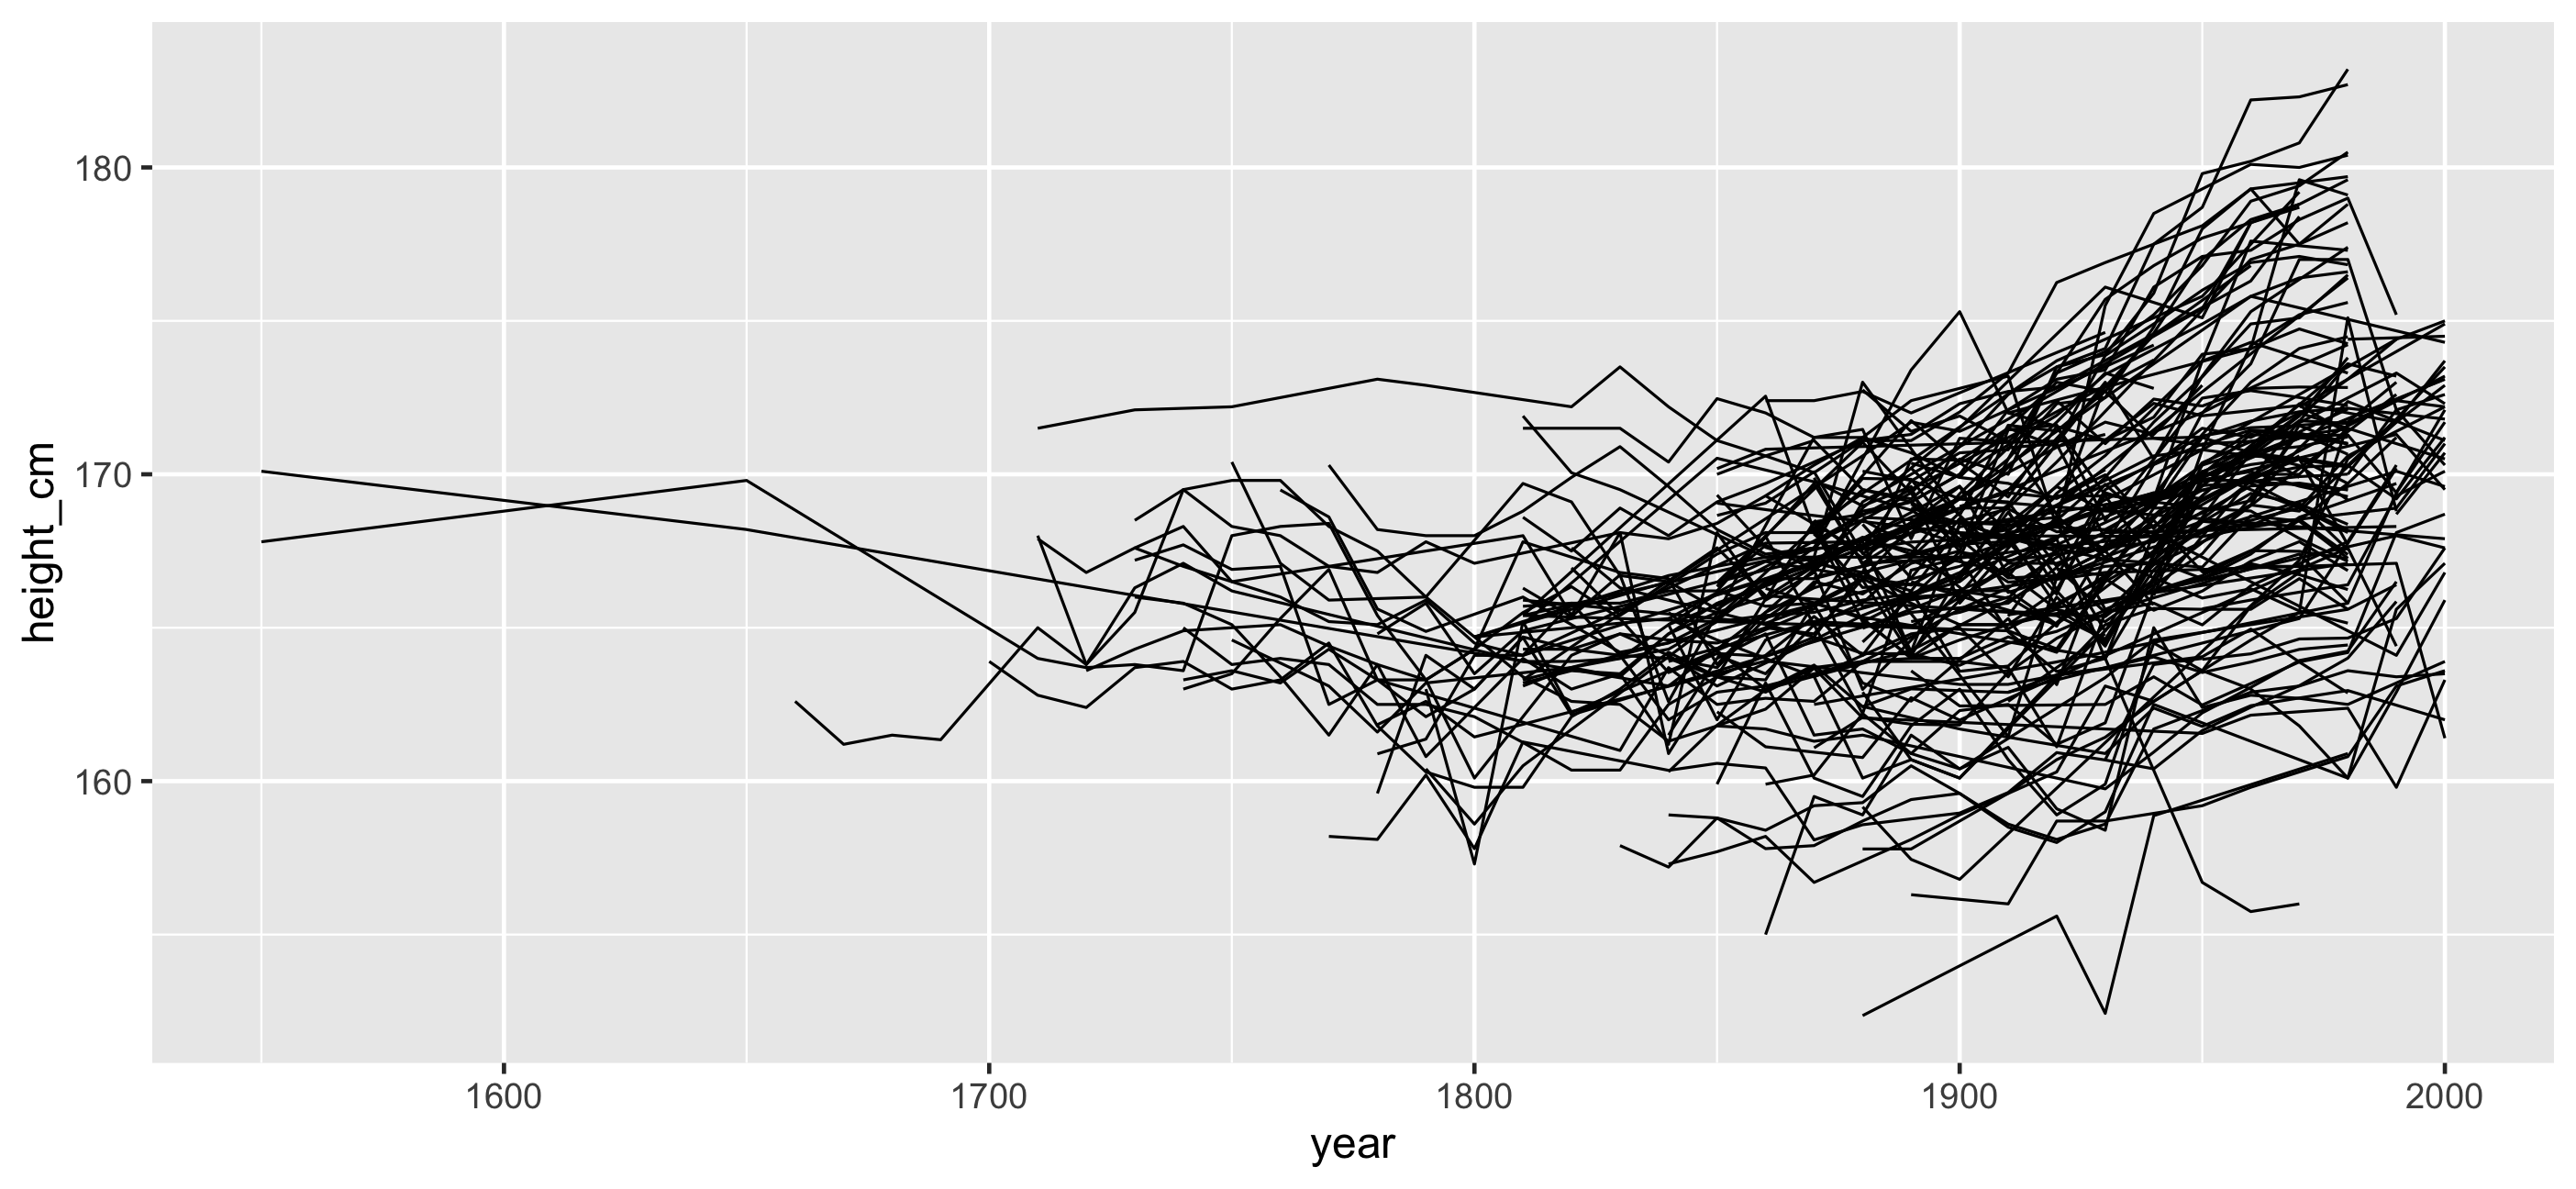
Problems:
- Overplotting
- We don't see the individuals
- We could look at 144 individual plots, but this doesn't help.
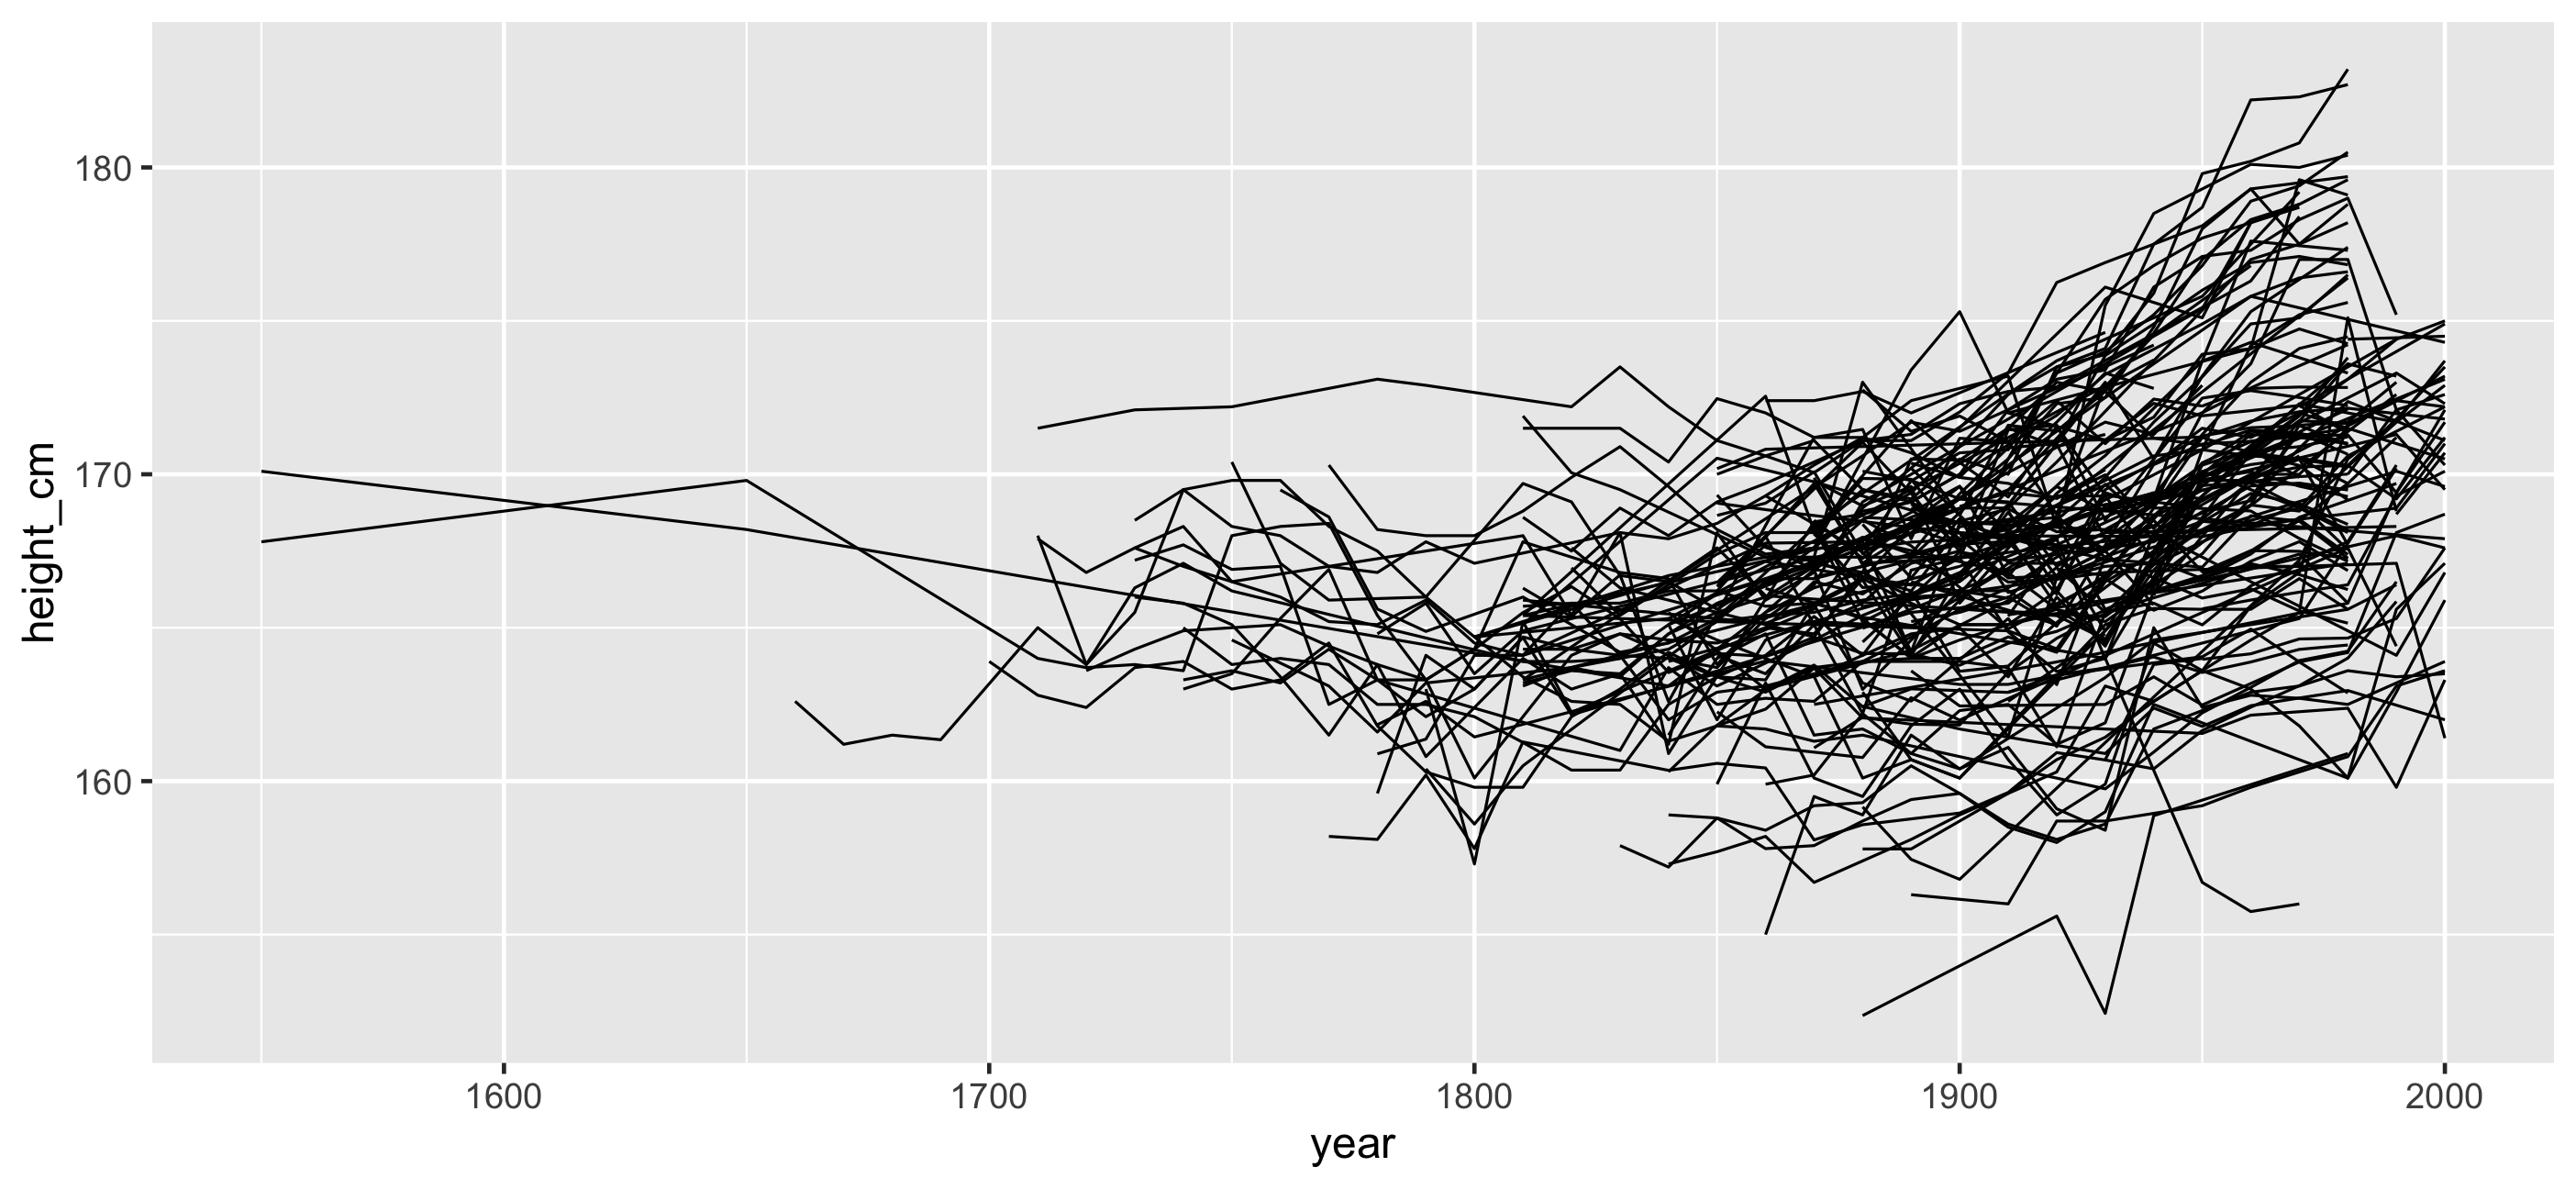
Does transparency help?
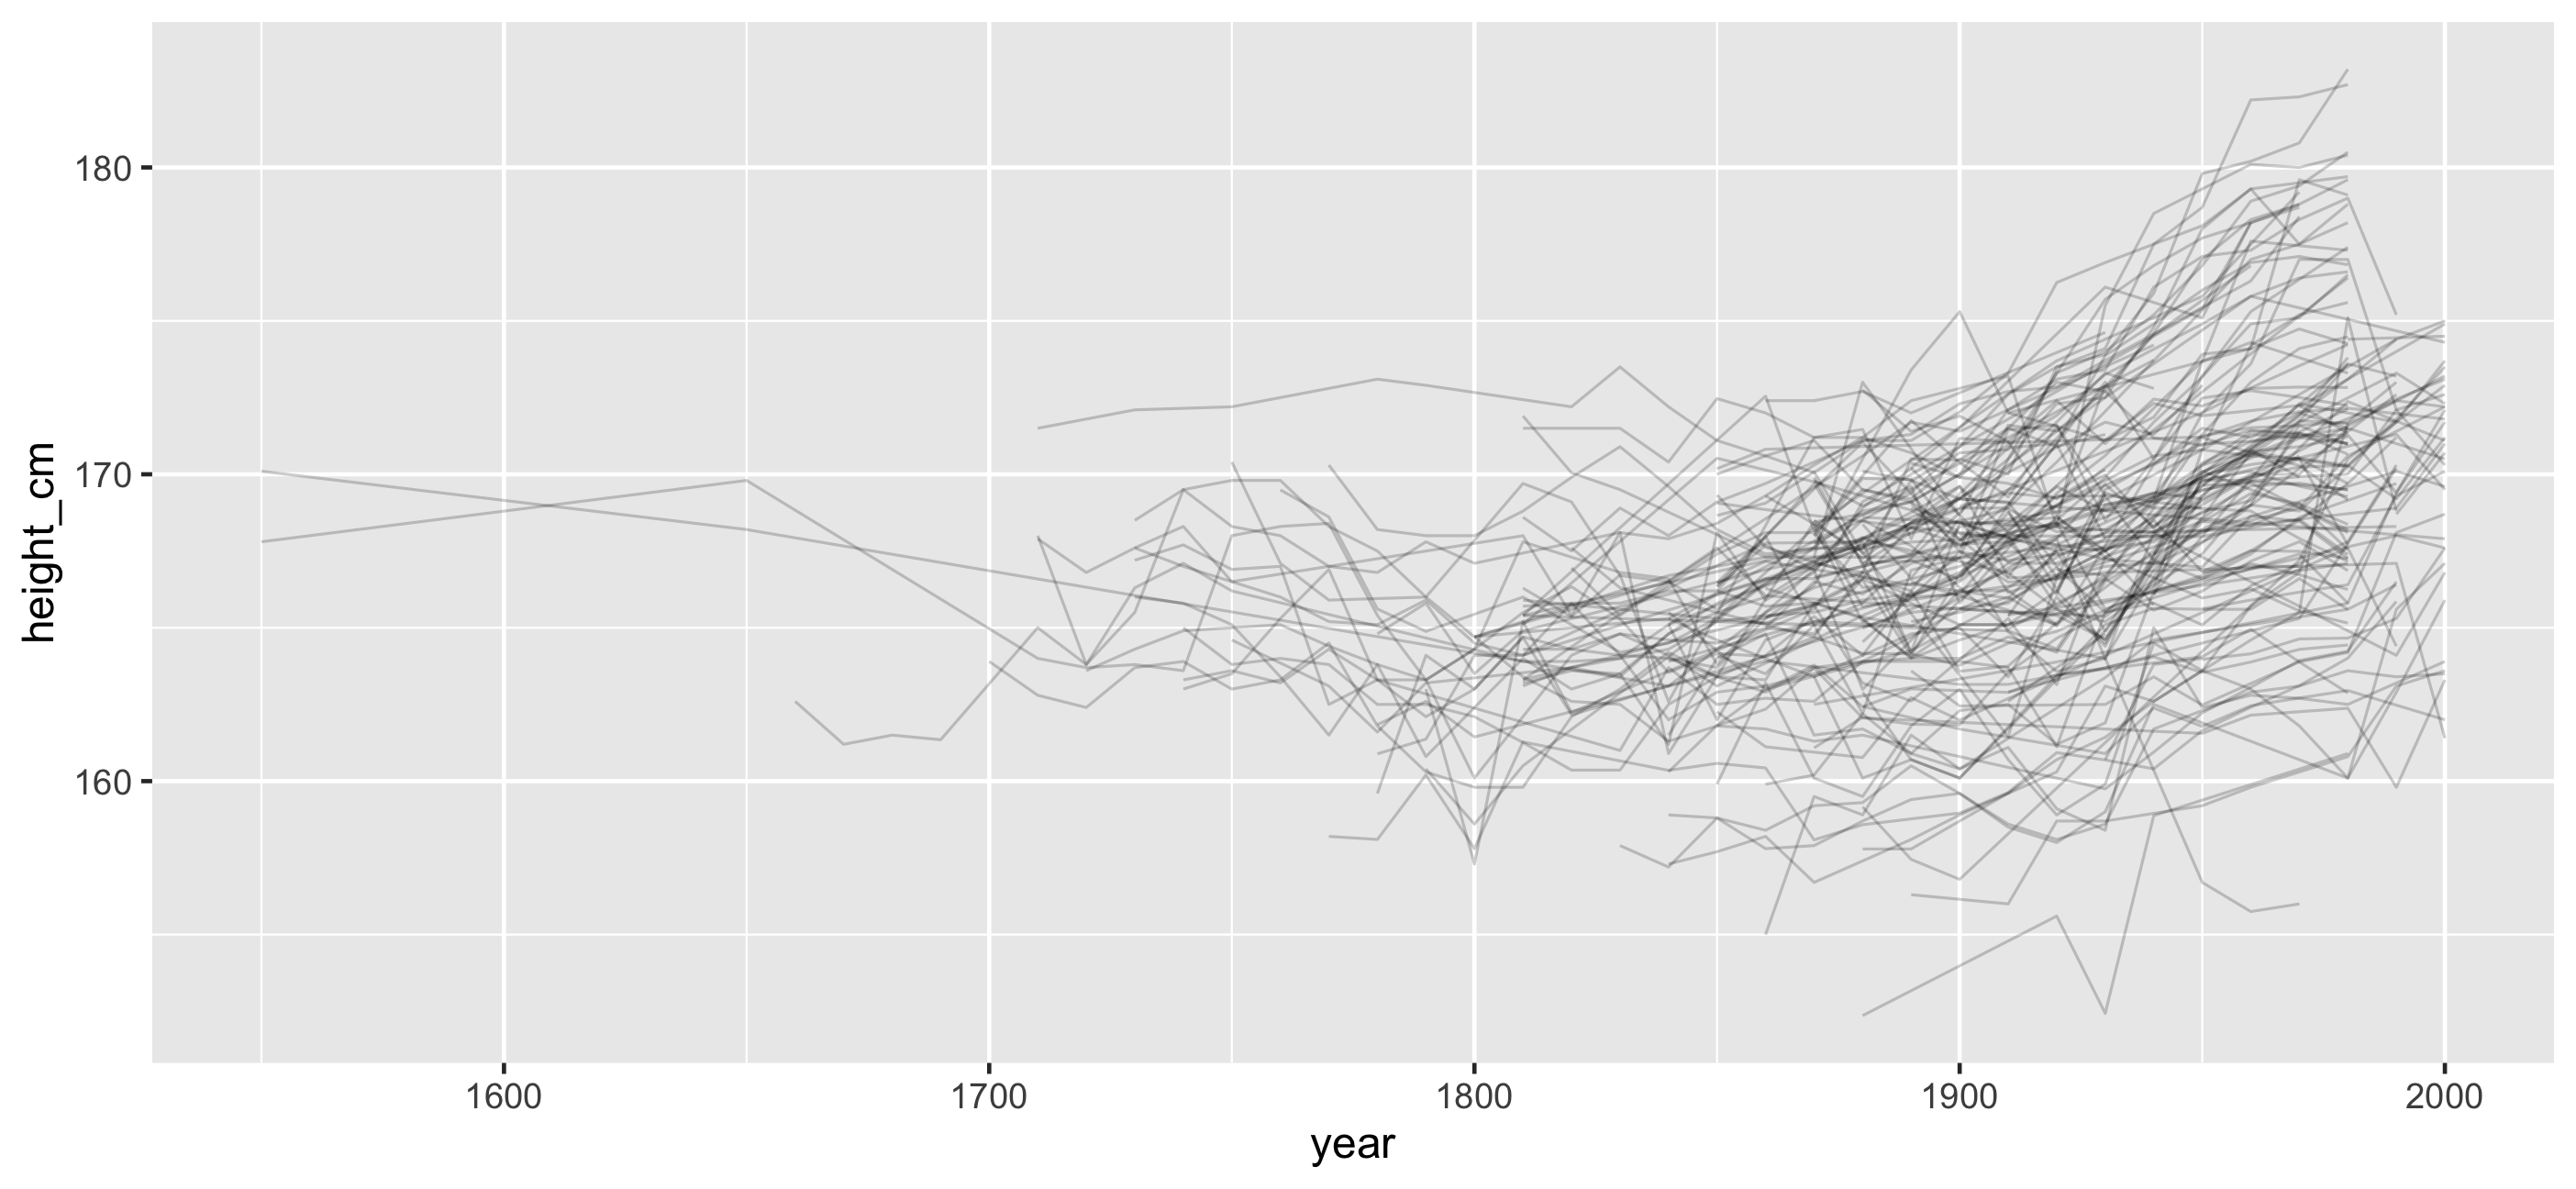
Does transparency + a model help?
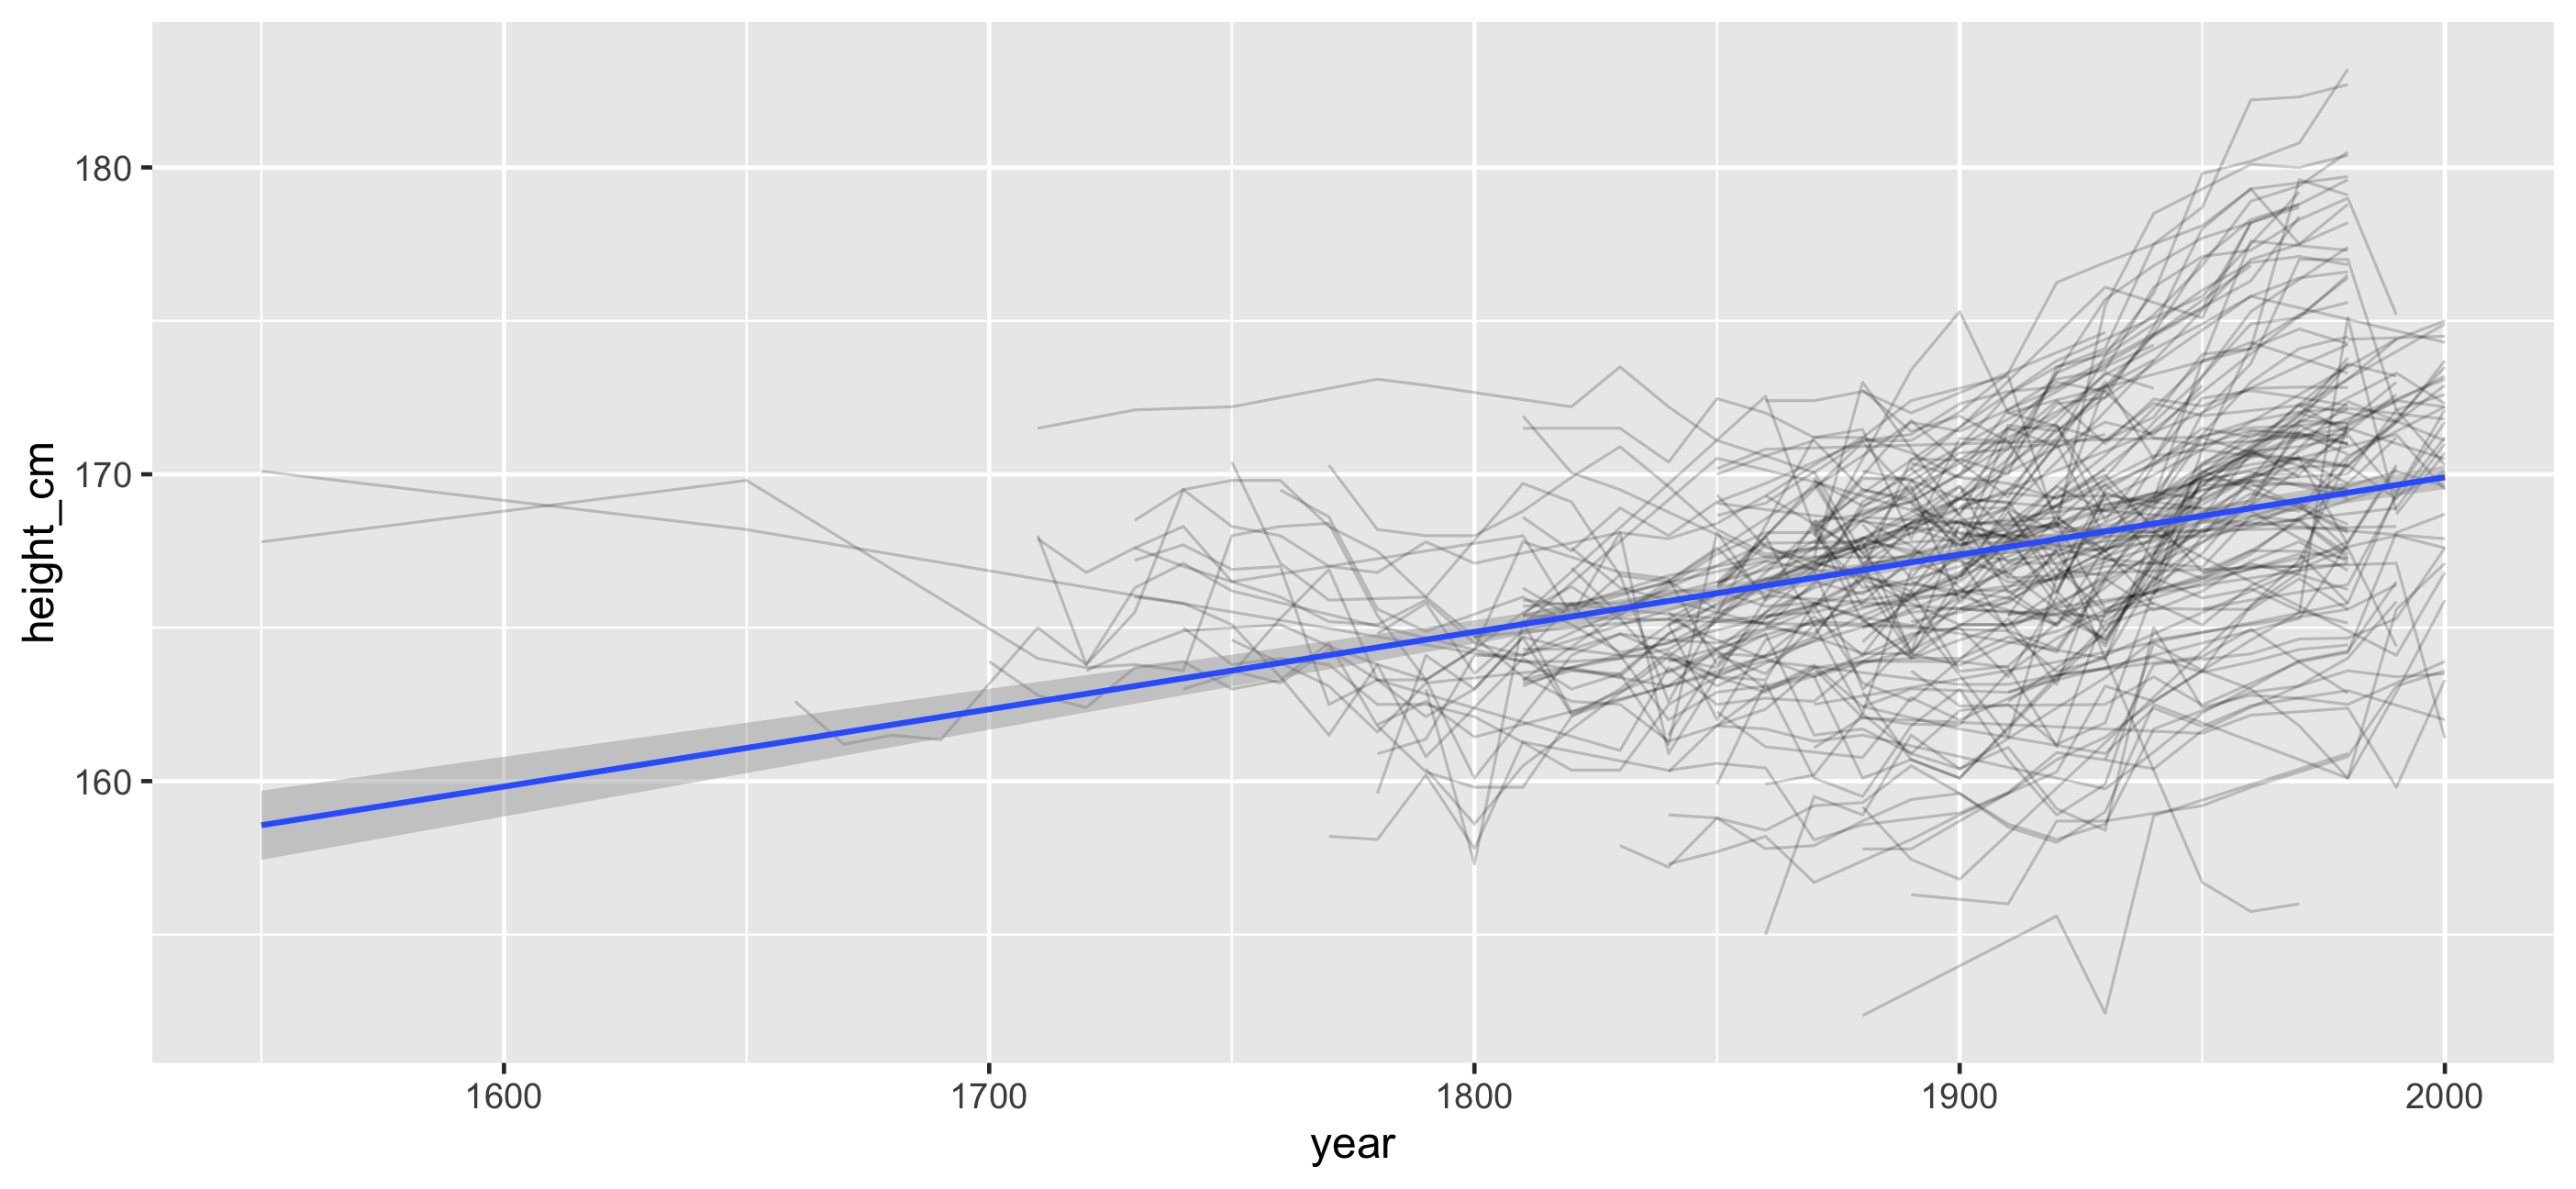
- This helps reduce the overplotting
- We only get the overall average. We dont get the rest of the information
This is still useful
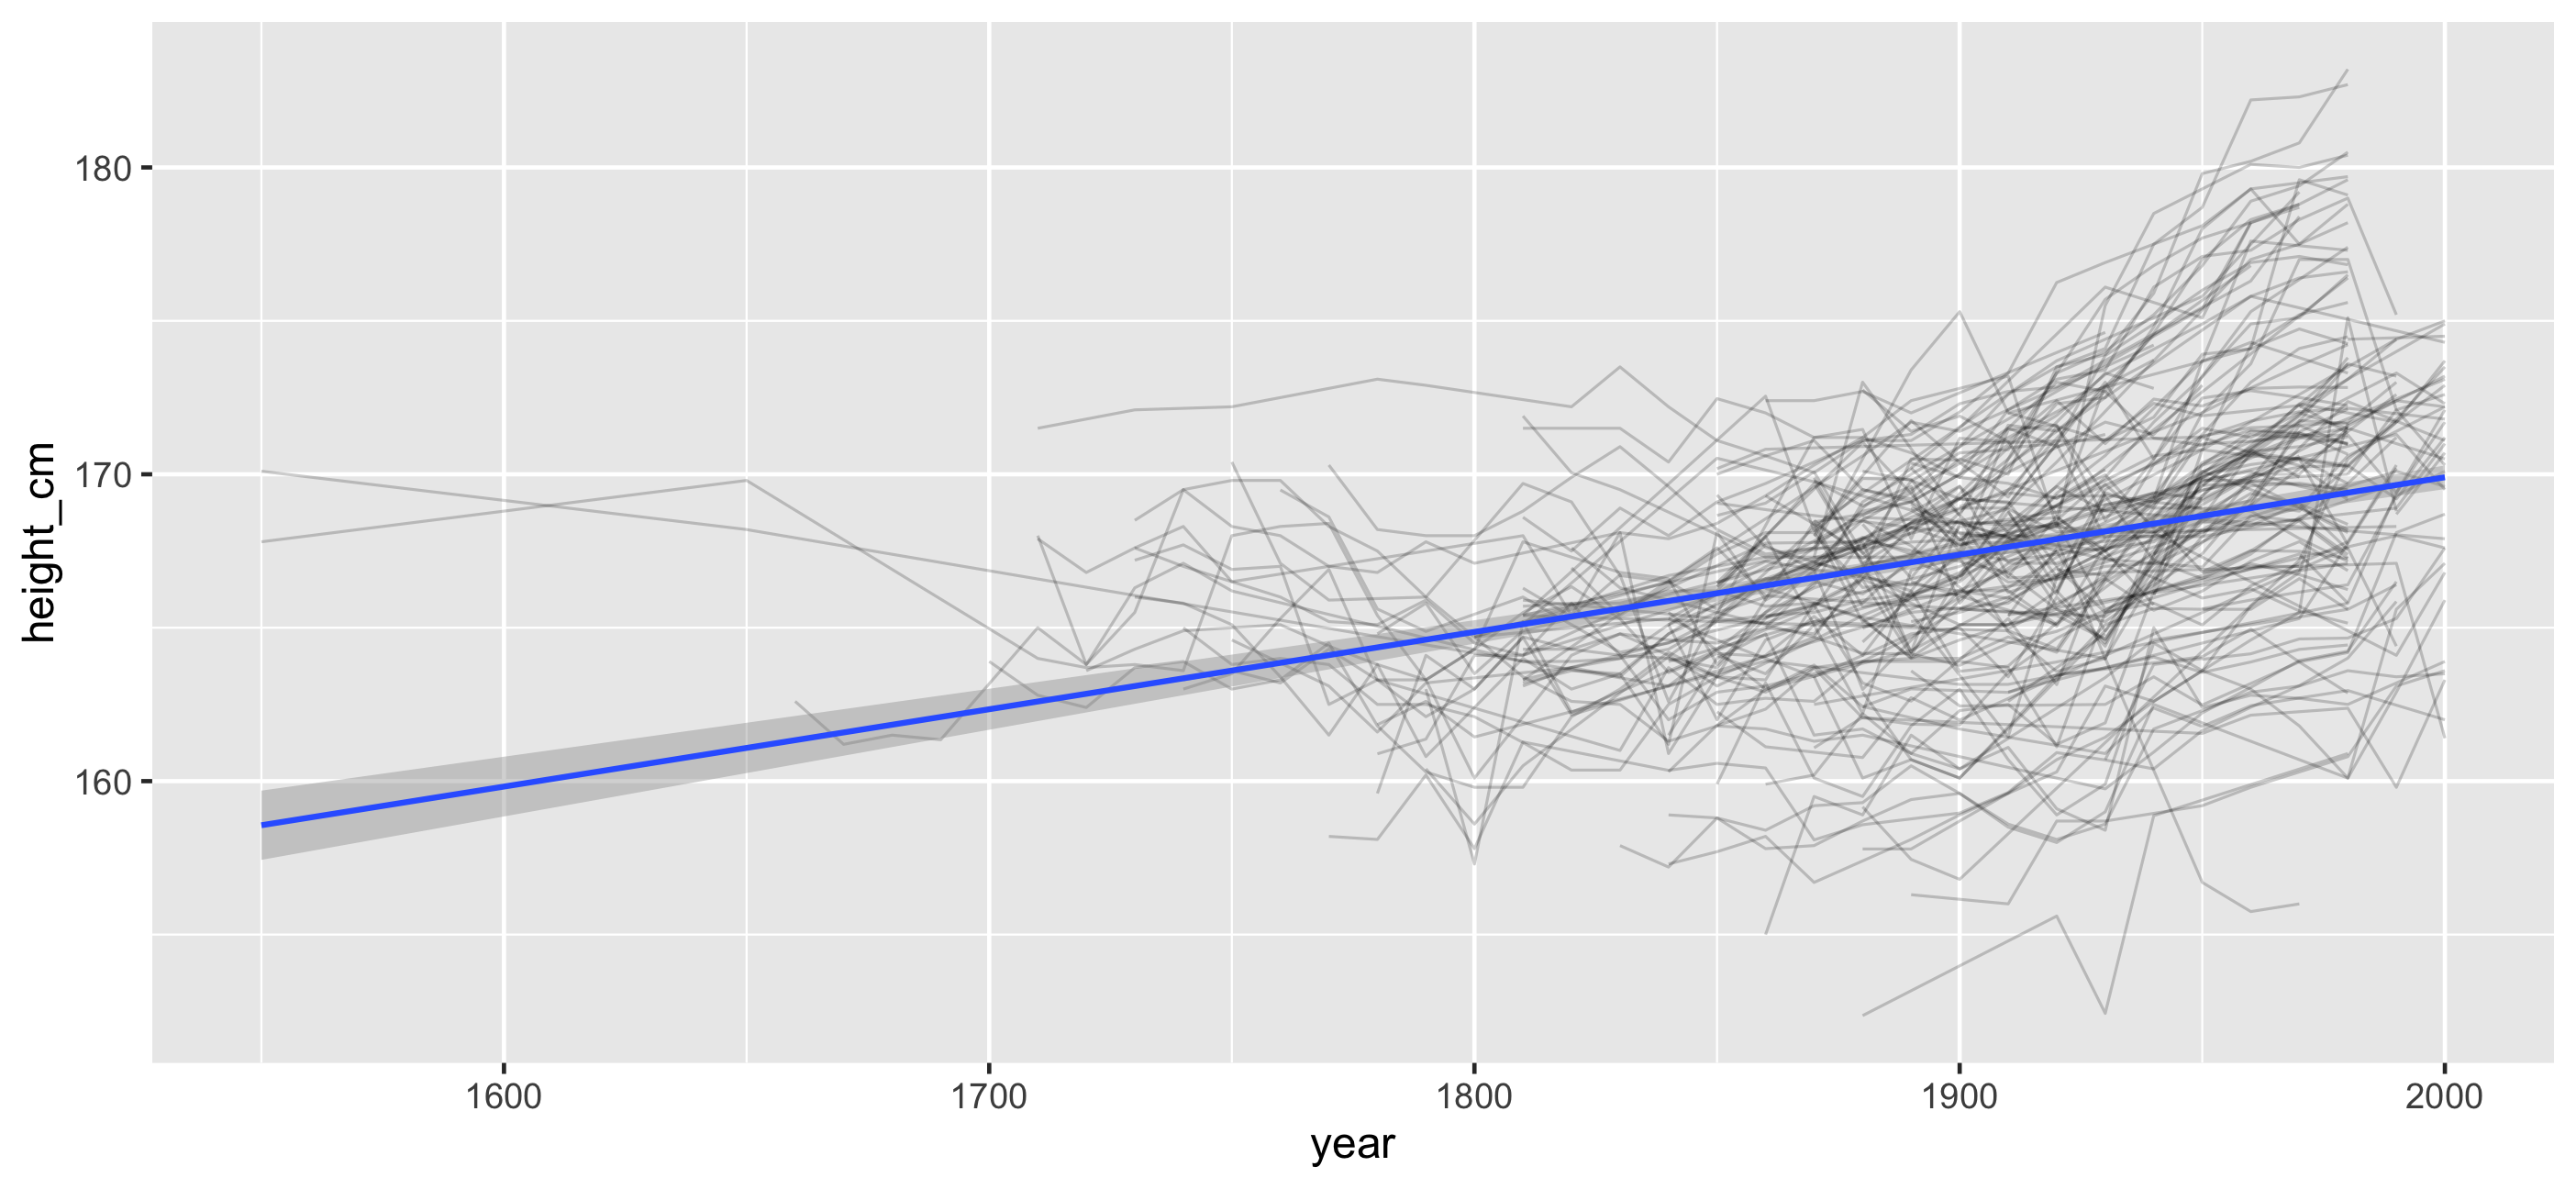
- We get information on what the average is, and how that behaves
- But we don't get the full story
- So, it depends on your need. If you have a designed experiment, where you stated that you would run some analysis, then you are doing this.
- ... But even then, wouldn't you rather explore the data?
- Who fits the models well / worst / best?
But we forget about the individuals
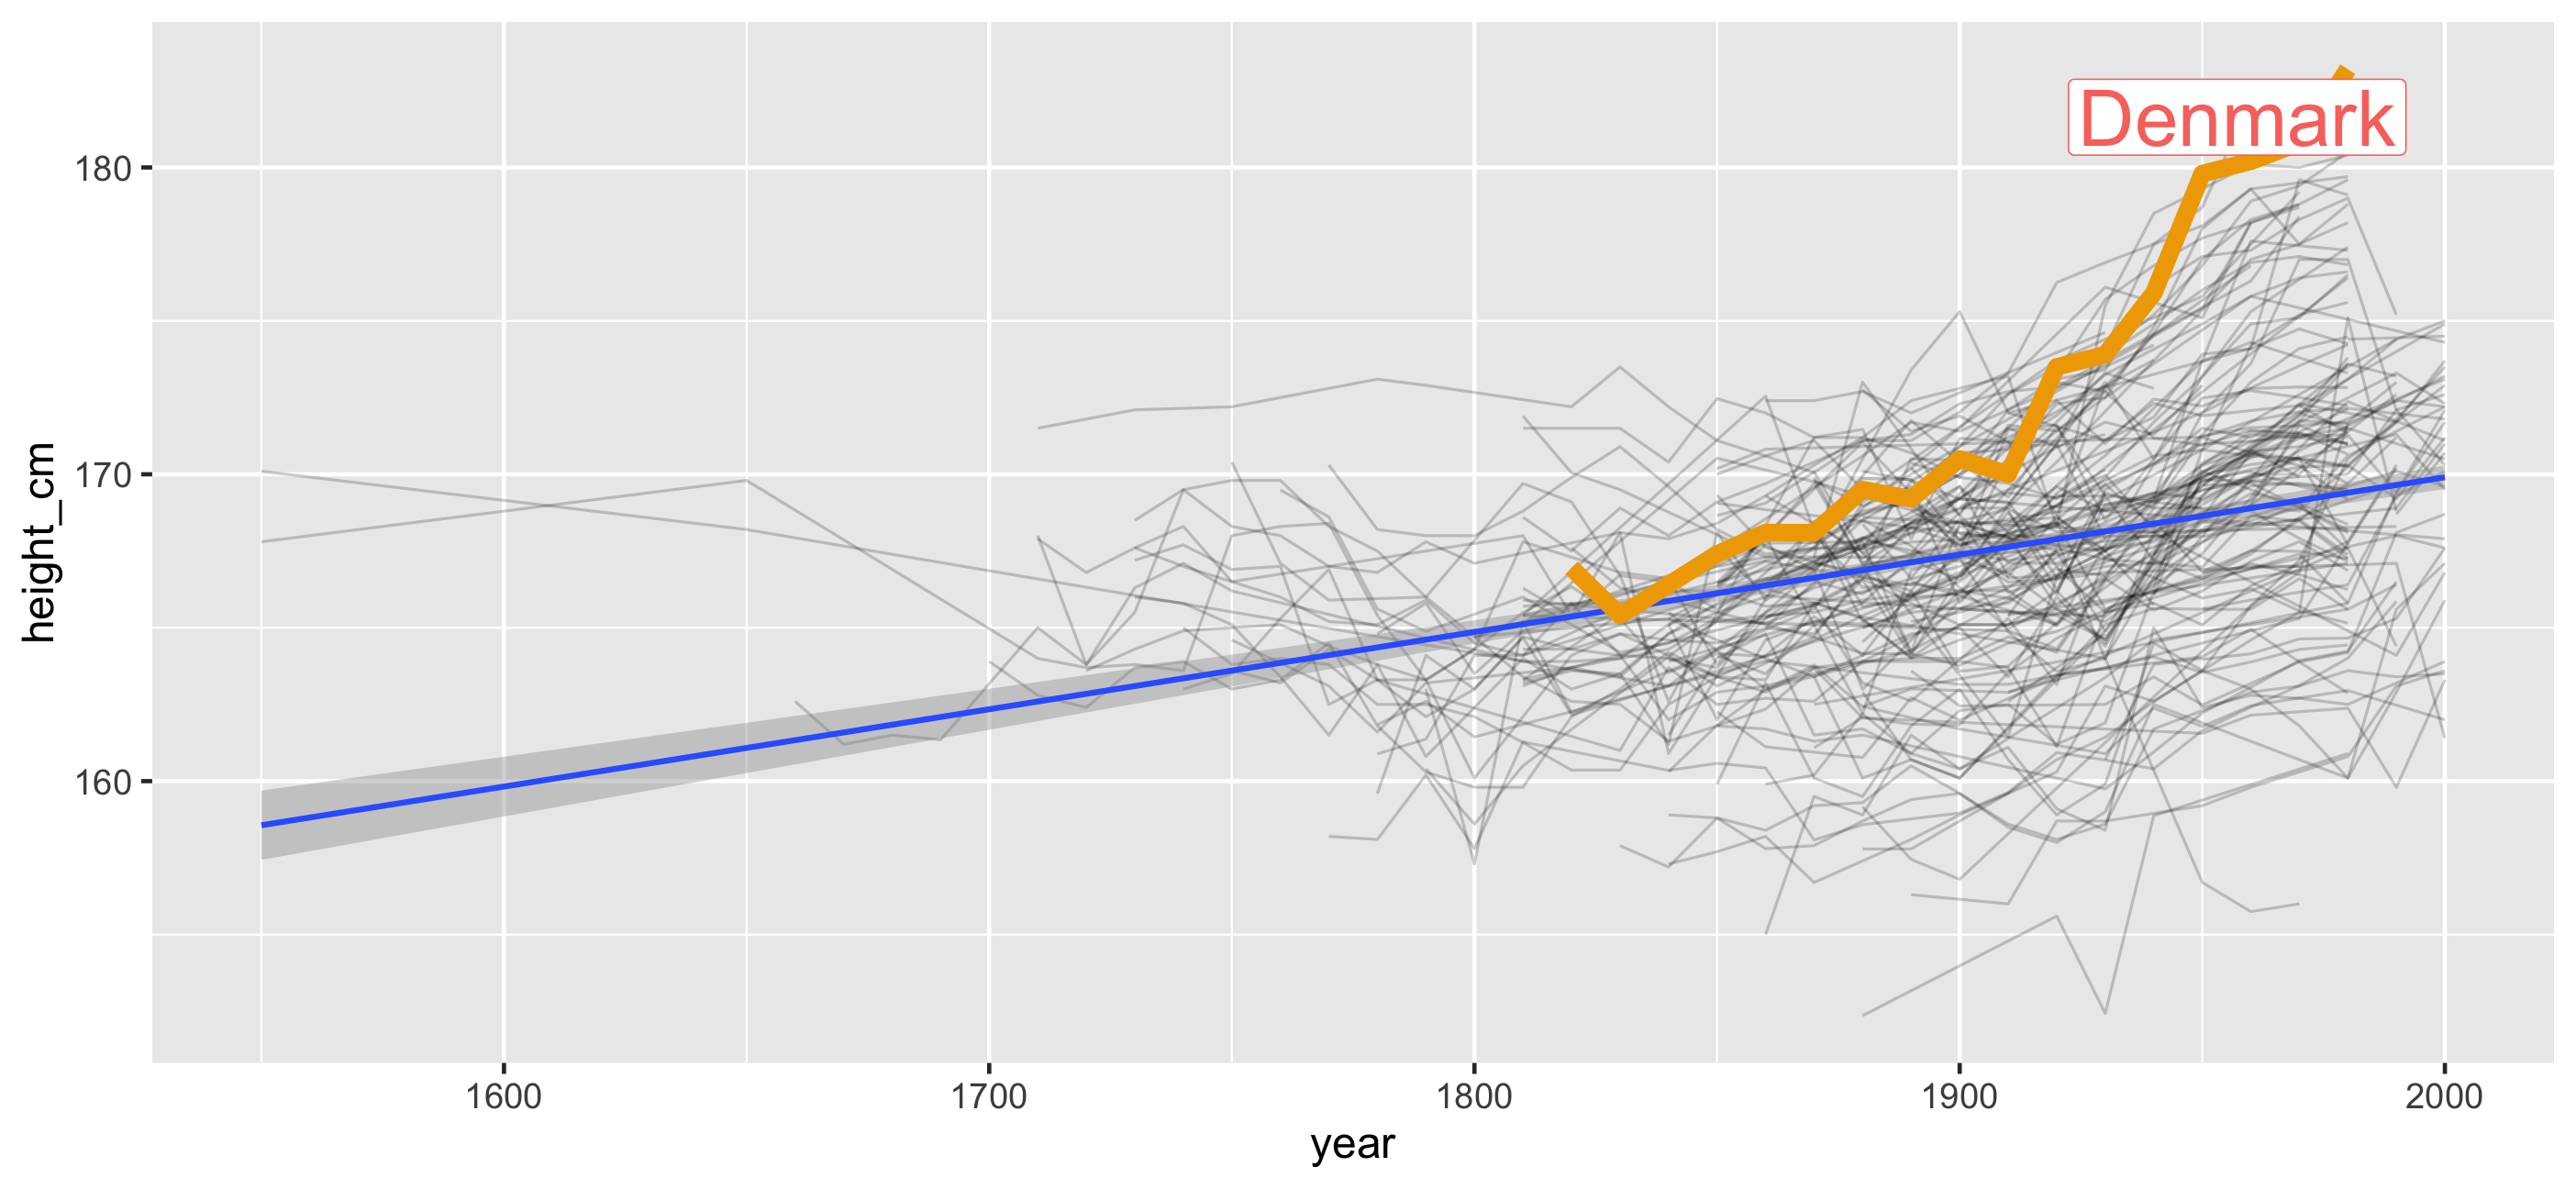
- The model might make some good overall predictions
- But it can be really ill suited for some individual
- Exploring this is somewhat clumsy - we need another way to explore
How do we get the most out of this plot?
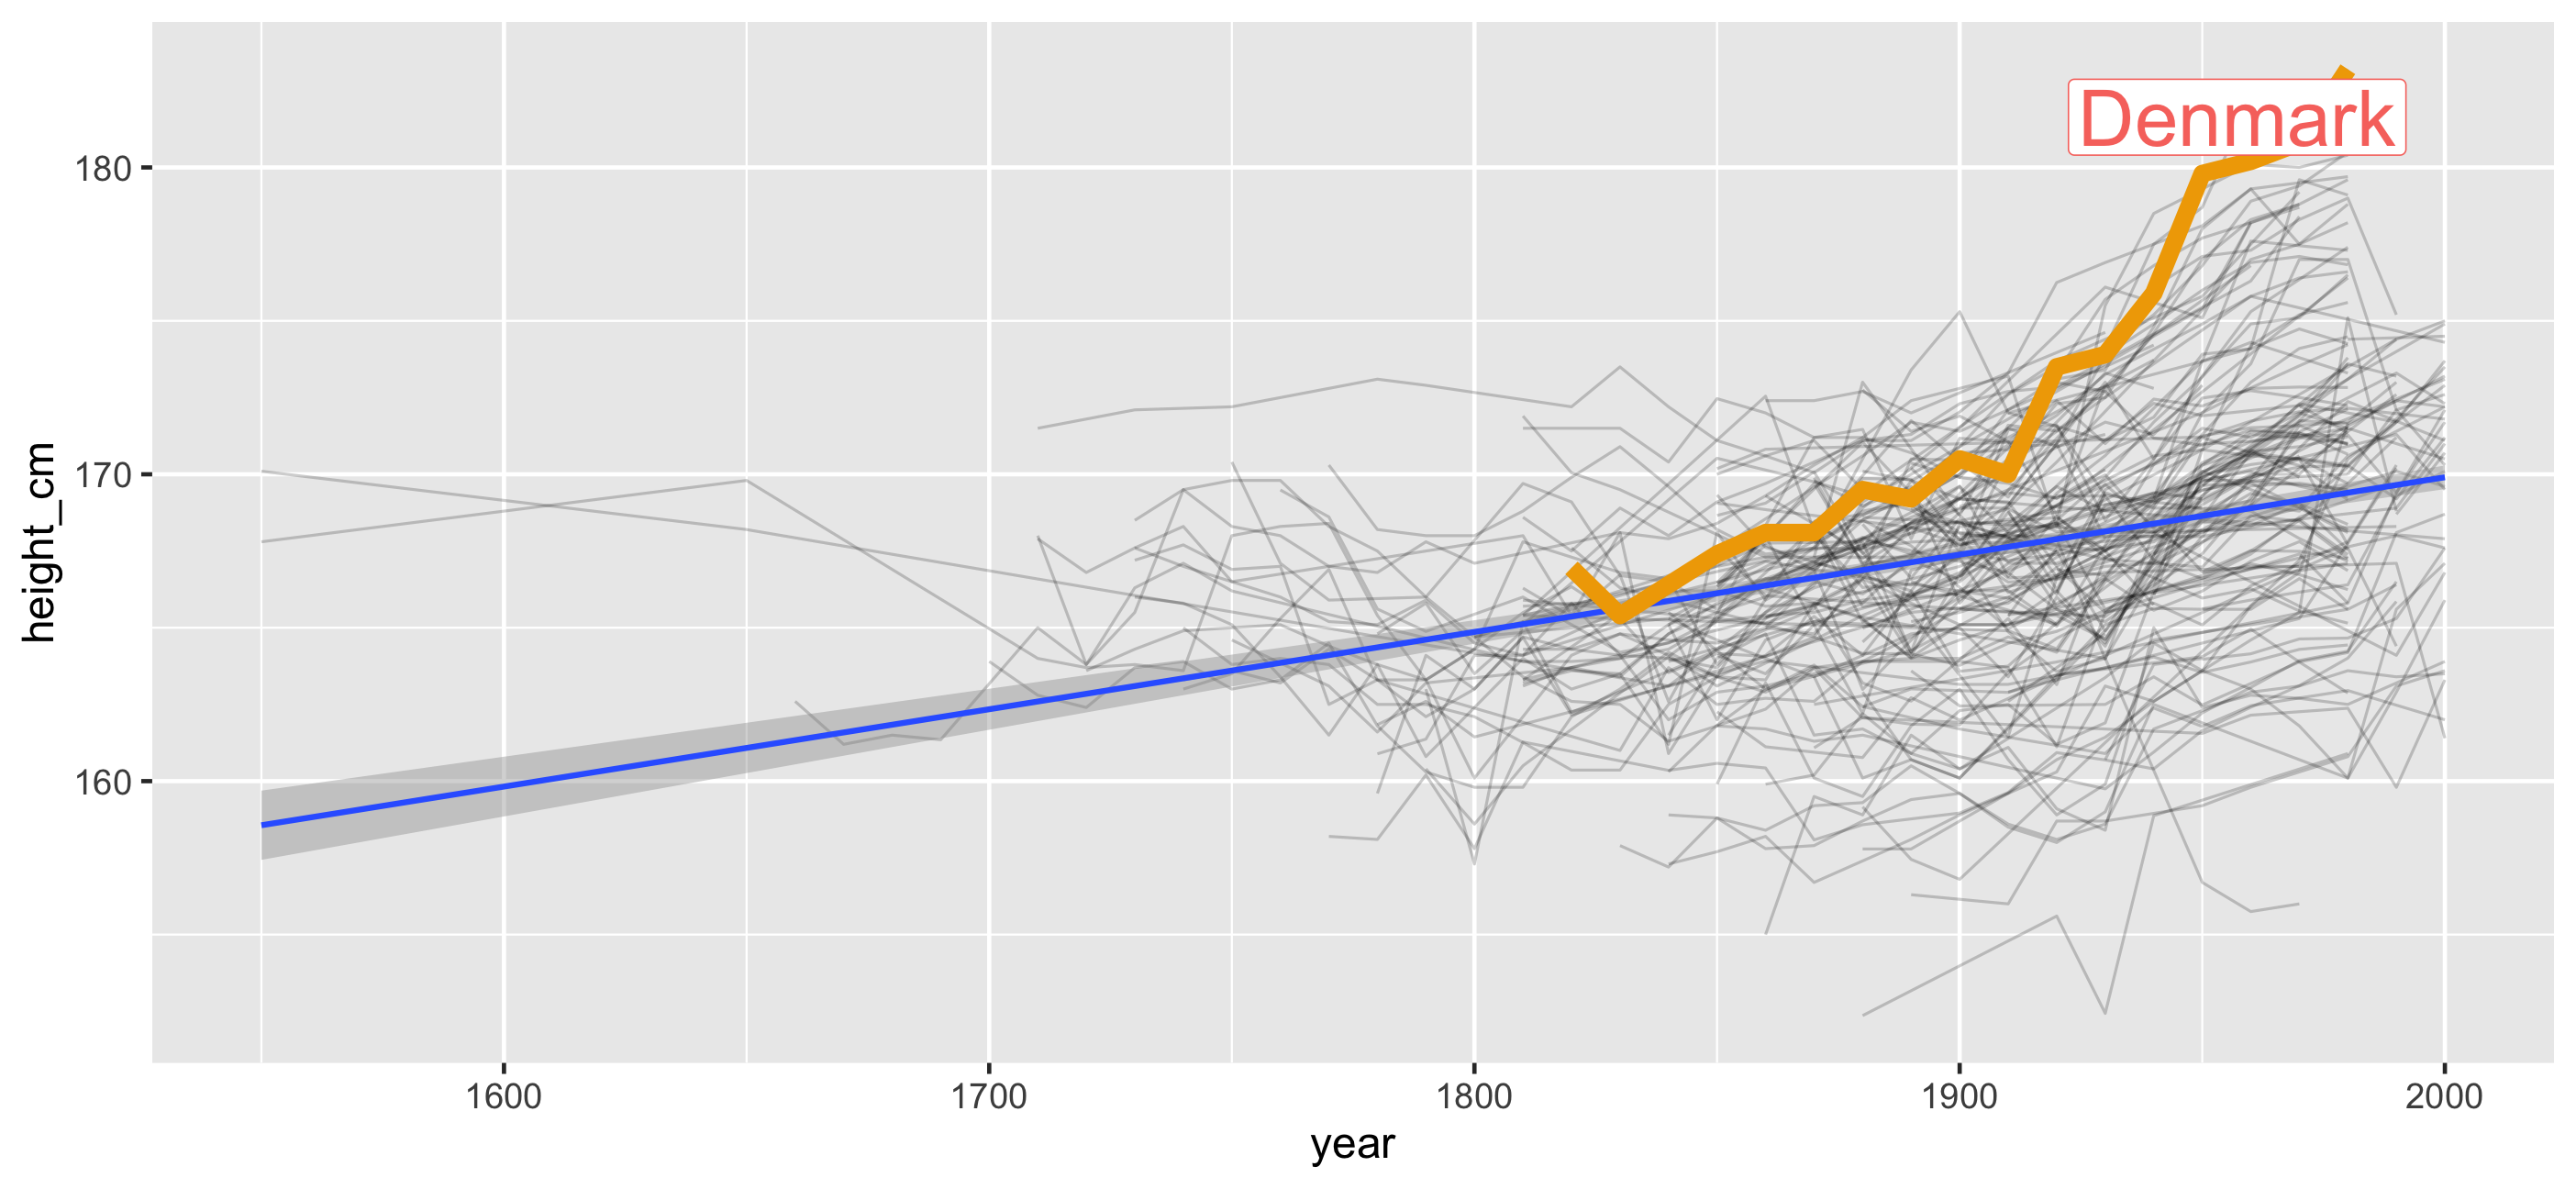
How do I even get started?!
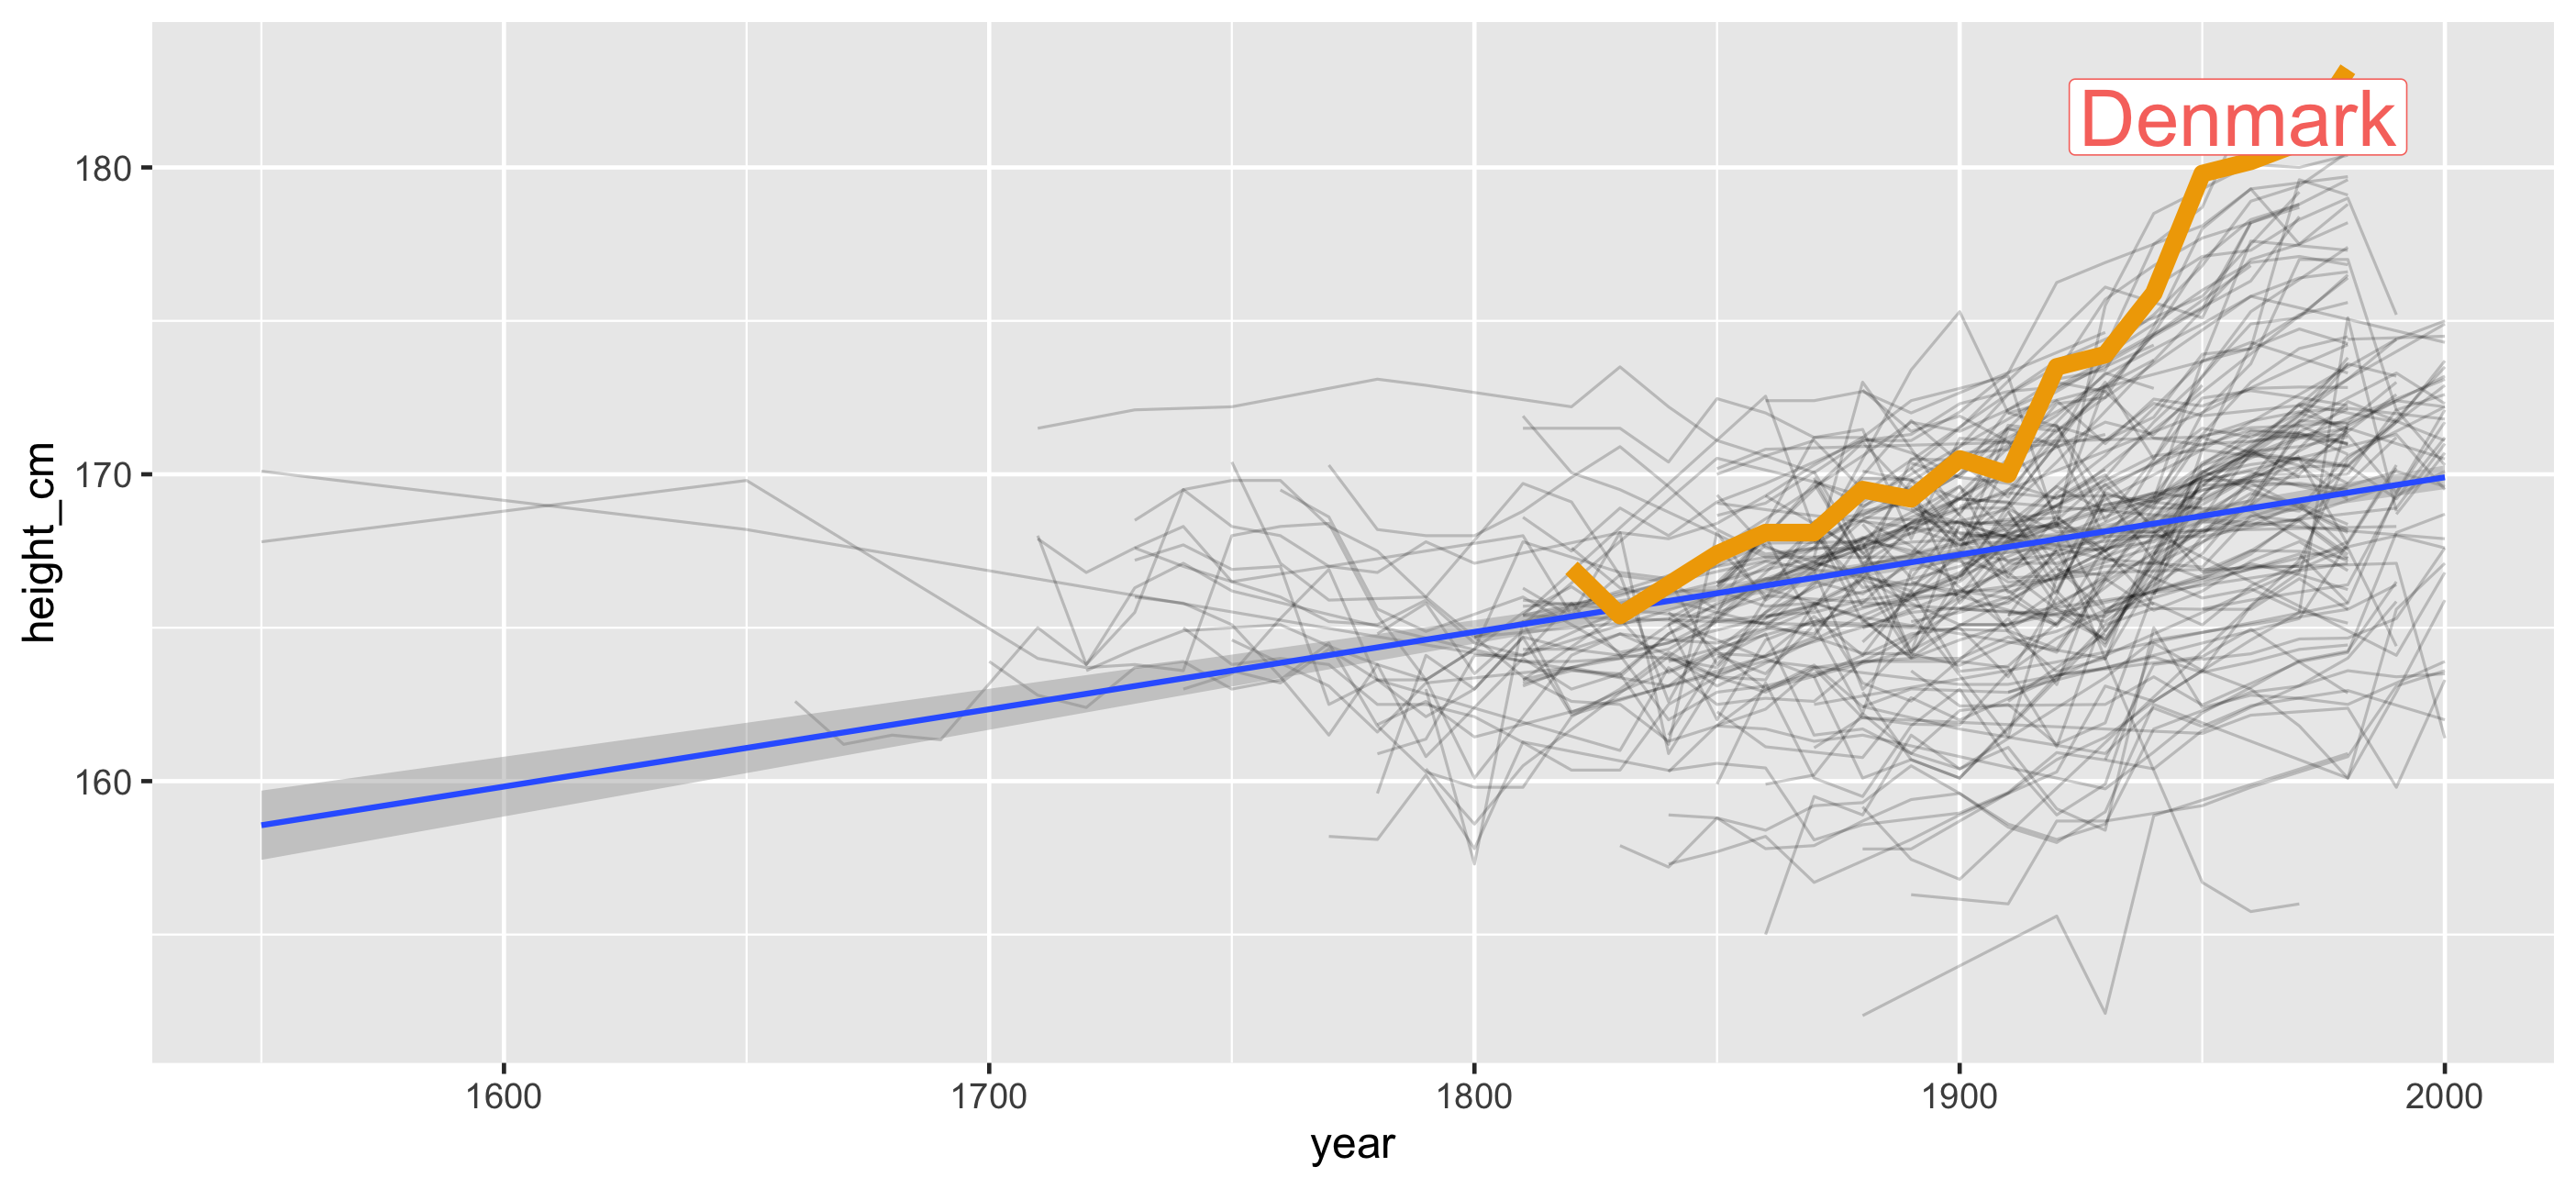
Problem #1: How do I look at some of the data?
Problem #1: How do I look at some of the data?
Problem #2: How do I find interesting observations?
Problem #1: How do I look at some of the data?
Problem #2: How do I find interesting observations?
Problem #3: How do I understand my statistical model
Introducing brolgar: brolgar.njtierney.com
- browsing
- over
- longitudinal data
- graphically, and
- analytically, in
- r
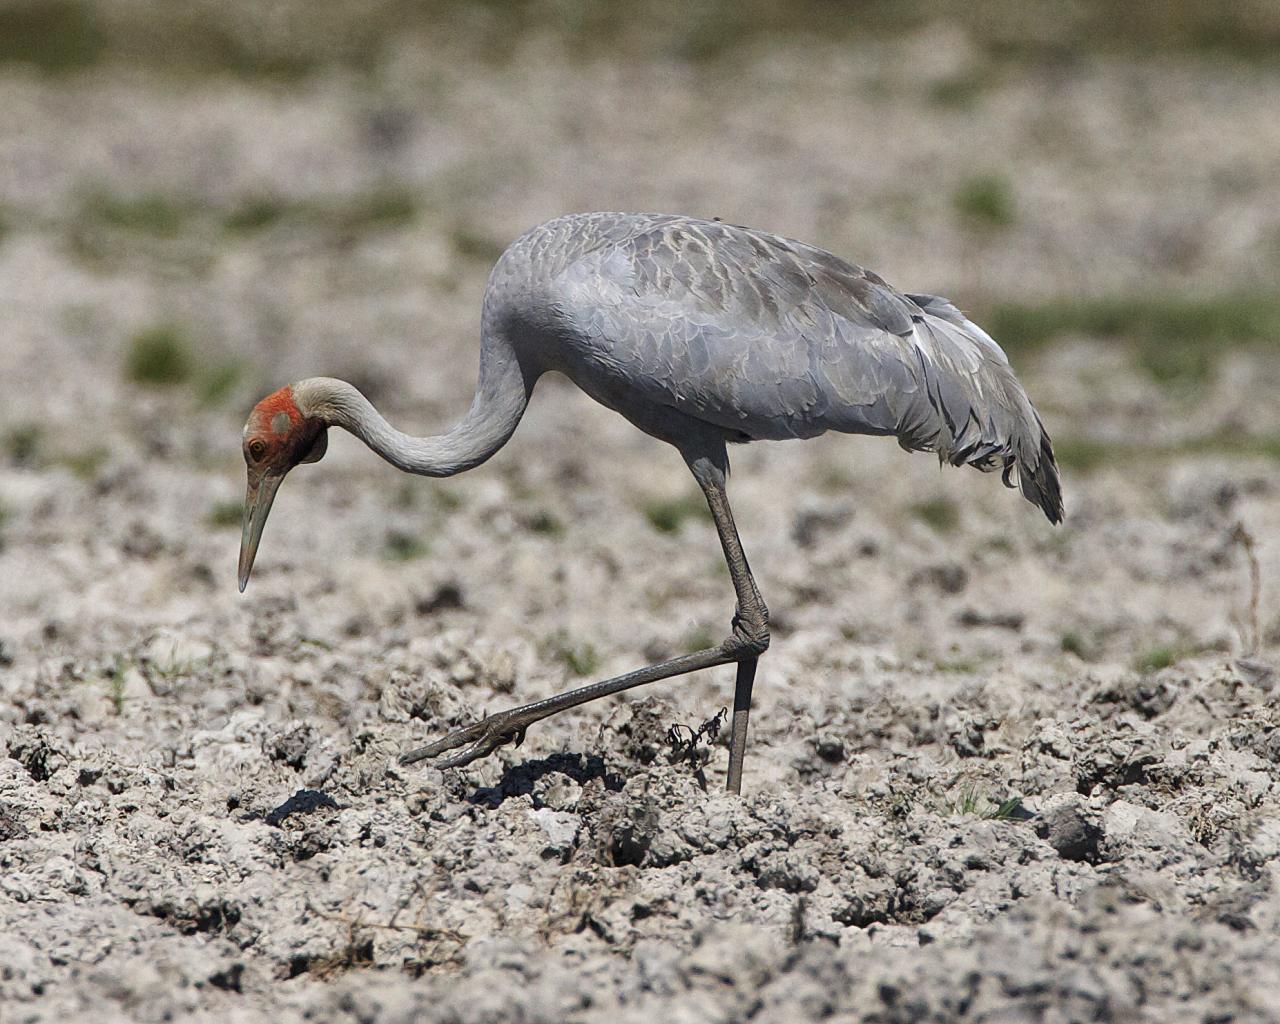
- It's a crane, it fishes, and it's a native Australian bird
What is longitudinal data?
Something observed sequentially over time
What is longitudinal data?
SomethingAnything that is observed sequentially over time is a time series
What is longitudinal data? Longitudinal data is a time series.
SomethingAnything that is observed sequentially over time is a time series
Longitudinal data as a time series 
heights <- as_tsibble(heights, index = year, key = country, regular = FALSE)- index: Your time variable
- key: Variable(s) defining individual groups (or series)
1. + 2. determine distinct rows in a tsibble.
(From Earo Wang's talk: Melt the clock)
Longitudinal data as a time series 
Key Concepts:
Record important time series information once, and use it many times in other places
- We add information about index + key:
- Index = Year
- Key = Country
## # A tsibble: 1,490 x 3 [!]## # Key: country [144]## country year height_cm## <chr> <dbl> <dbl>## 1 Afghanistan 1870 168.## 2 Afghanistan 1880 166.## 3 Afghanistan 1930 167.## 4 Afghanistan 1990 167.## 5 Afghanistan 2000 161.## 6 Albania 1880 170.## # … with 1,484 more rowsRemember:
key = variable(s) defining individual groups (or series)
Problem #1: How do I look at some of the data?
Problem #1: How do I look at some of the data?
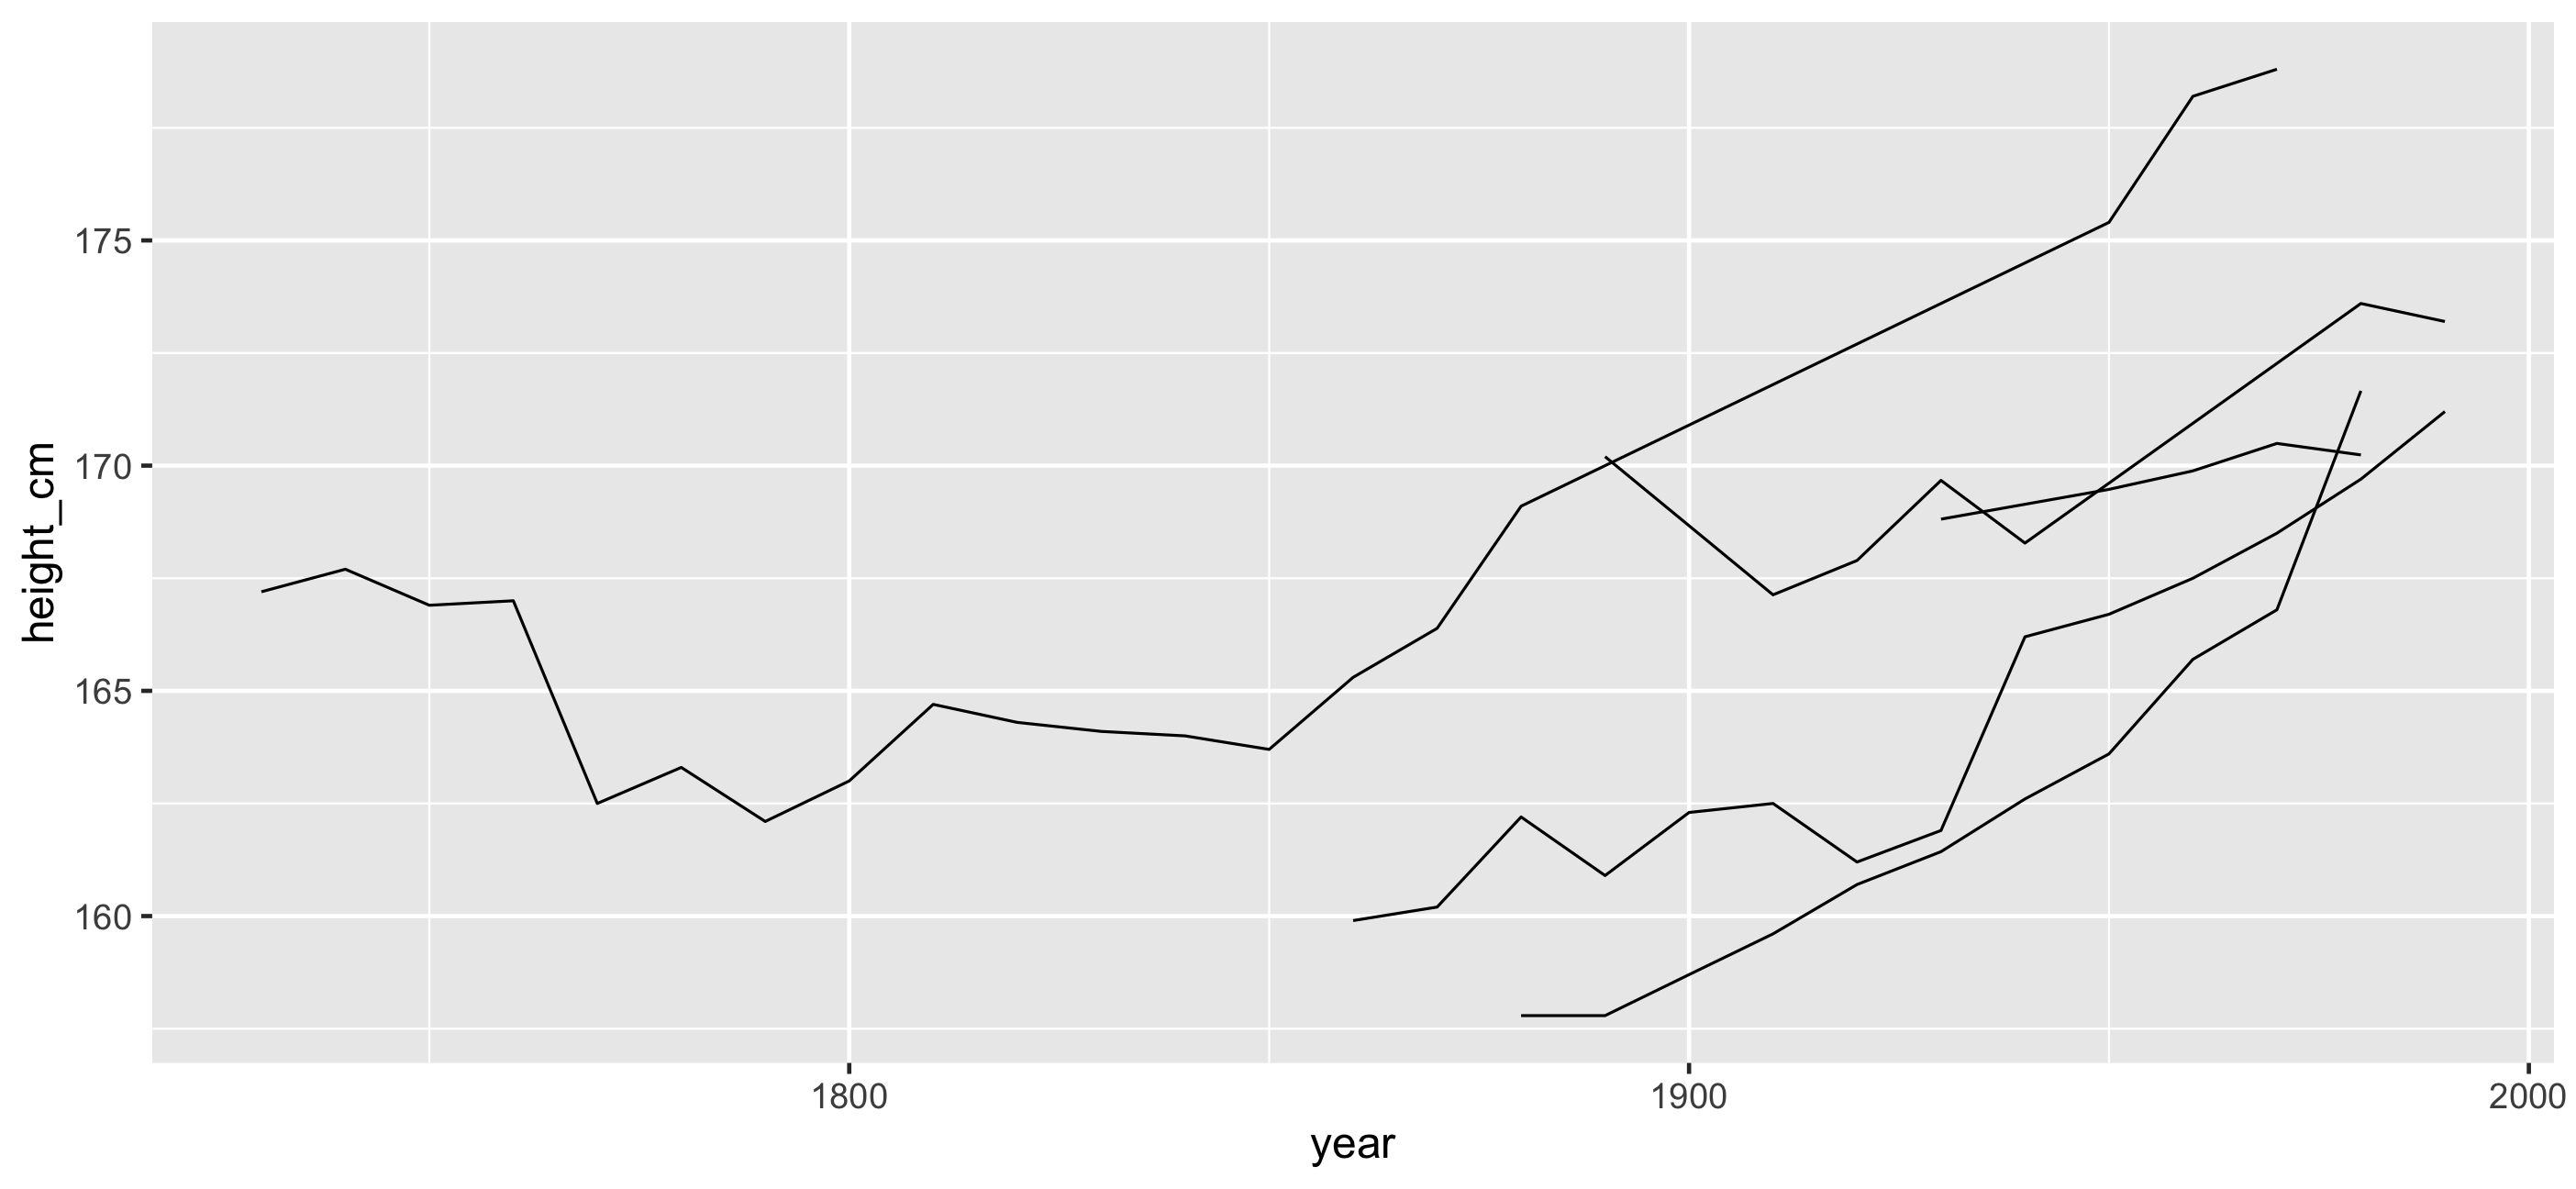
Look at only a sample of the data:
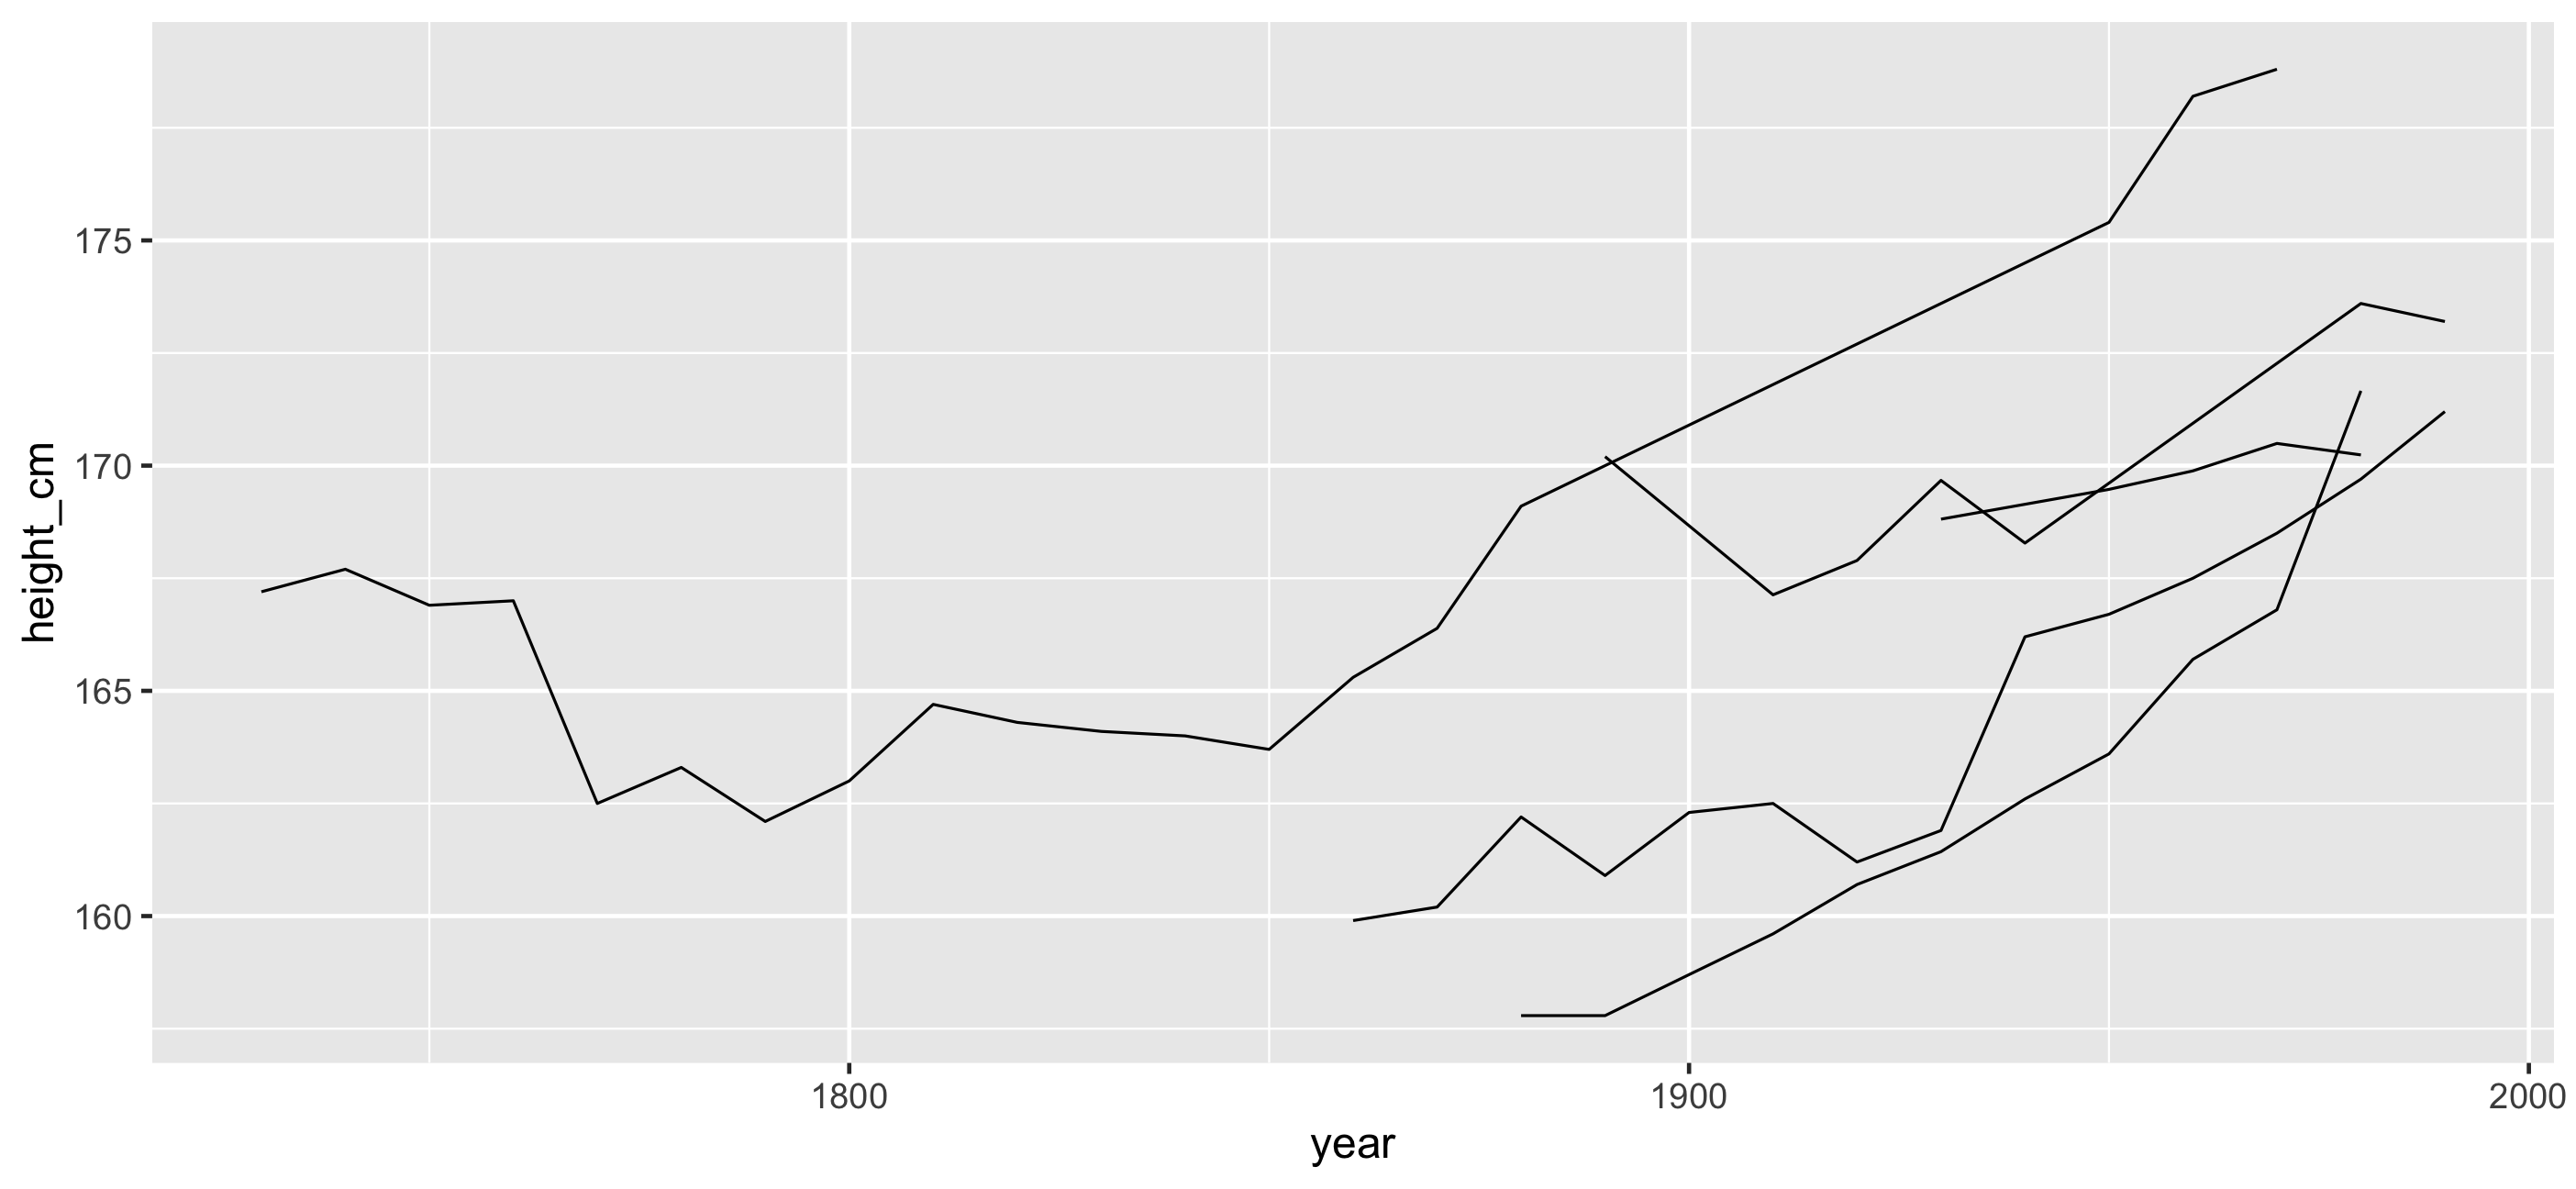
Sample n rows with sample_n()
Sample n rows with sample_n()
heights %>% sample_n(5)Sample n rows with sample_n()
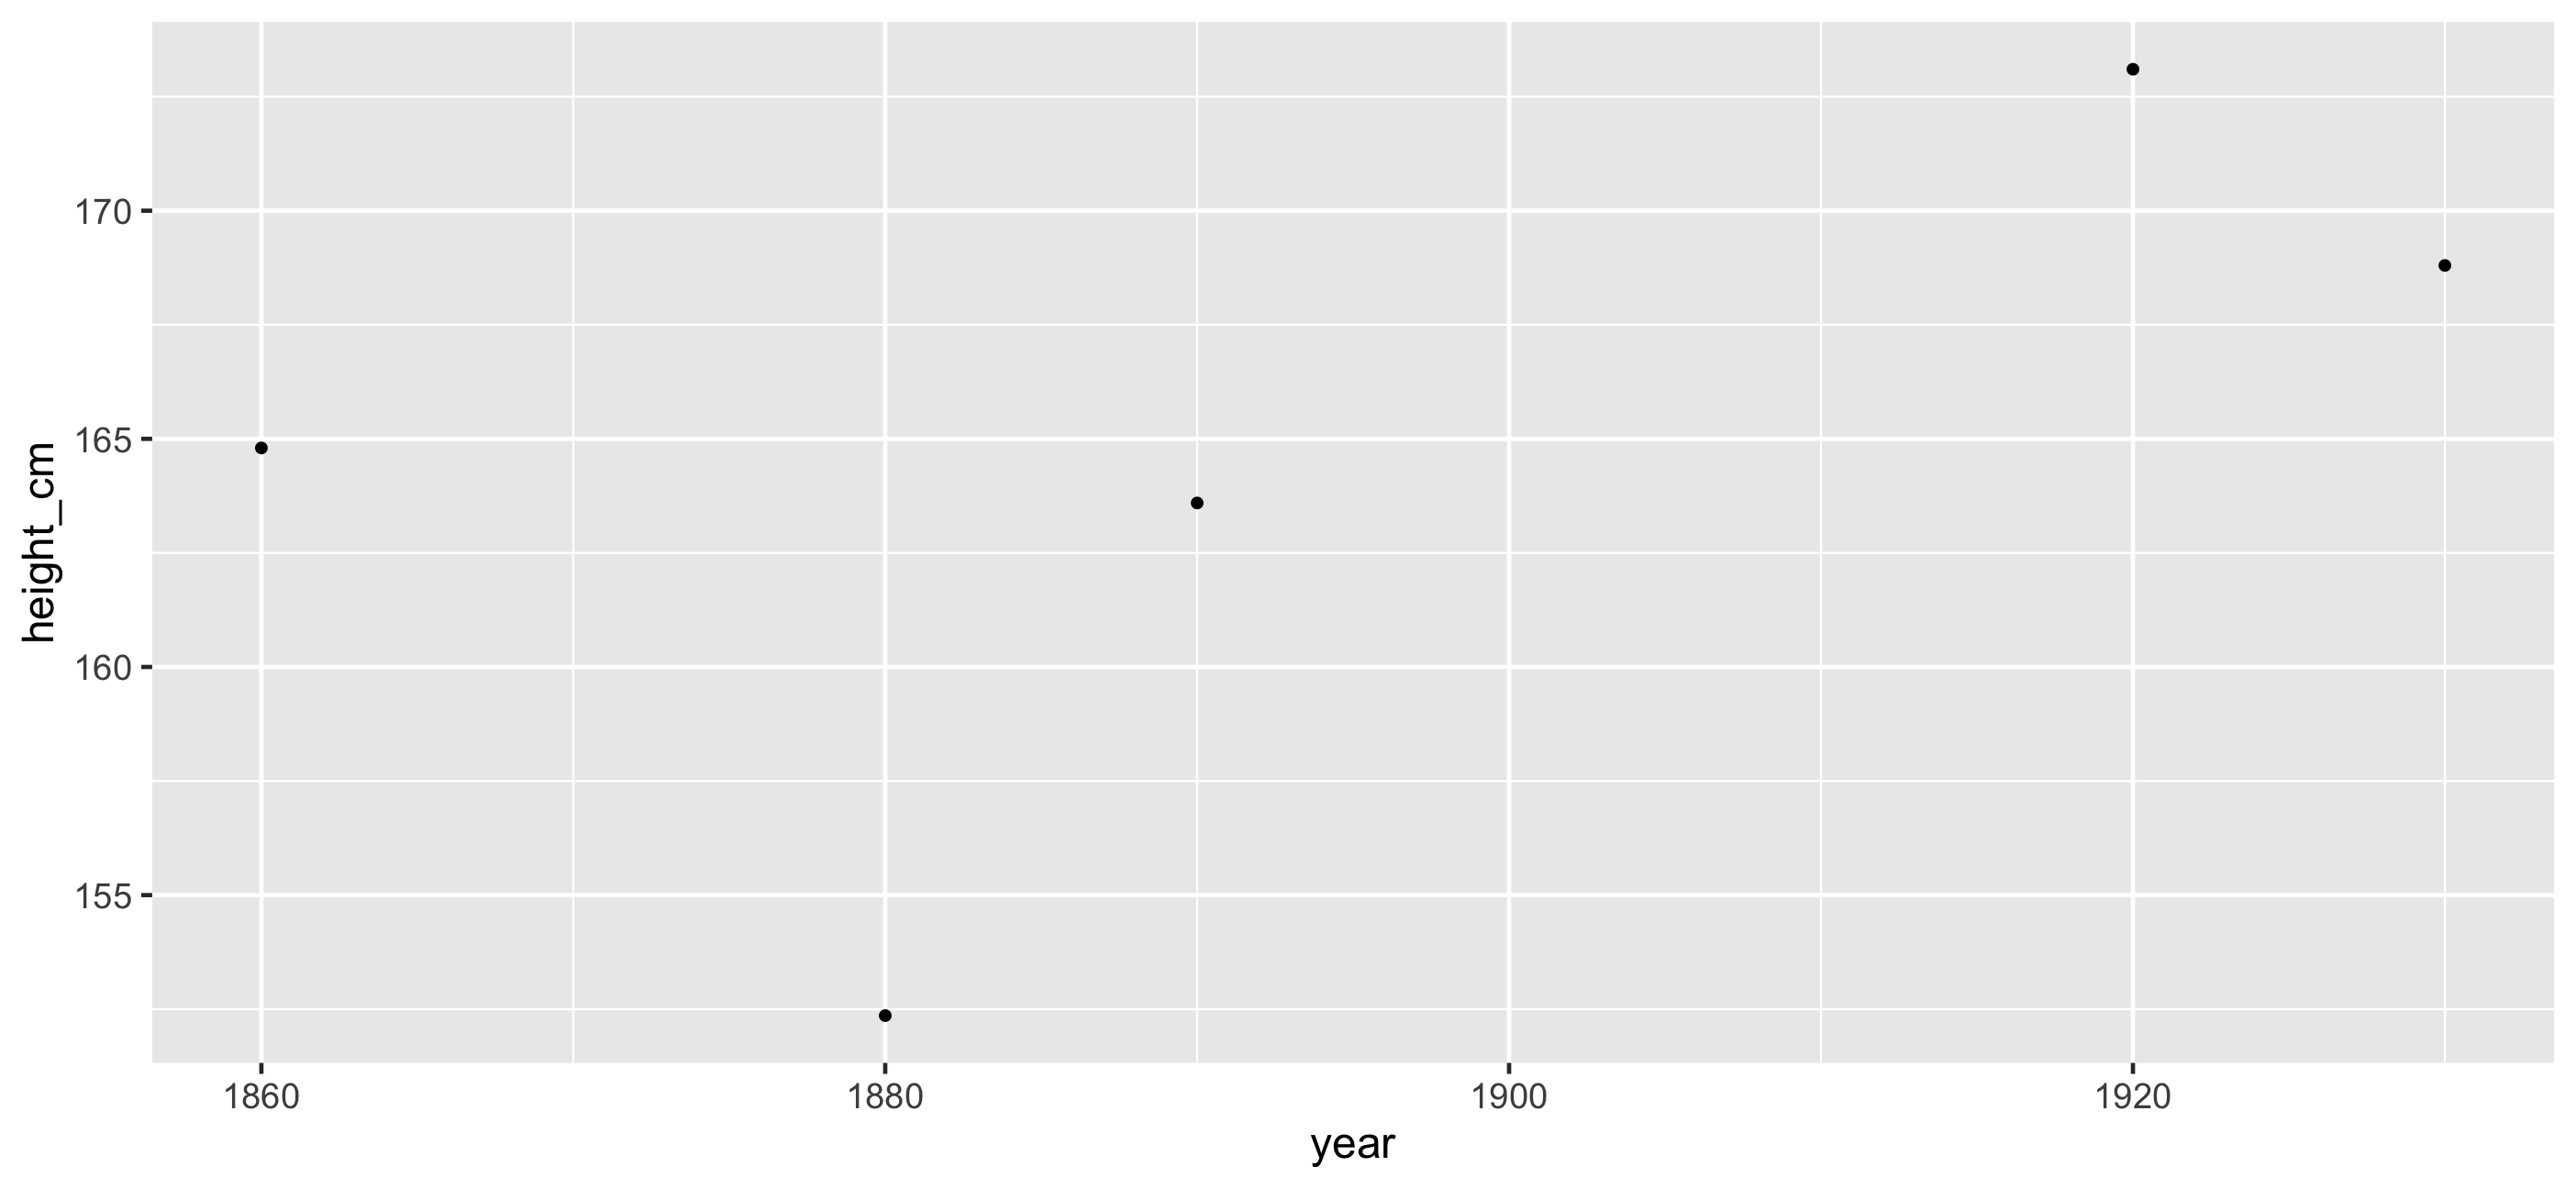
heights %>% sample_n(5)## # A tsibble: 5 x 3 [!]## # Key: country [5]## country year height_cm## <chr> <dbl> <dbl>## 1 Cambodia 1860 165.## 2 Bolivia 1890 164.## 3 Macedonia 1930 169.## 4 United States 1920 173.## 5 Papua New Guinea 1880 152.Sample n rows with sample_n()
Sample n rows with sample_n()
## # A tsibble: 5 x 3 [!]## # Key: country [5]## country year height_cm## <chr> <dbl> <dbl>## 1 Cambodia 1860 165.## 2 Bolivia 1890 164.## 3 Macedonia 1930 169.## 4 United States 1920 173.## 5 Papua New Guinea 1880 152.Sample n rows with sample_n()
## # A tsibble: 5 x 3 [!]## # Key: country [5]## country year height_cm## <chr> <dbl> <dbl>## 1 Cambodia 1860 165.## 2 Bolivia 1890 164.## 3 Macedonia 1930 169.## 4 United States 1920 173.## 5 Papua New Guinea 1880 152.... sampling needs to select not random rows of the data, but the keys - the countries.
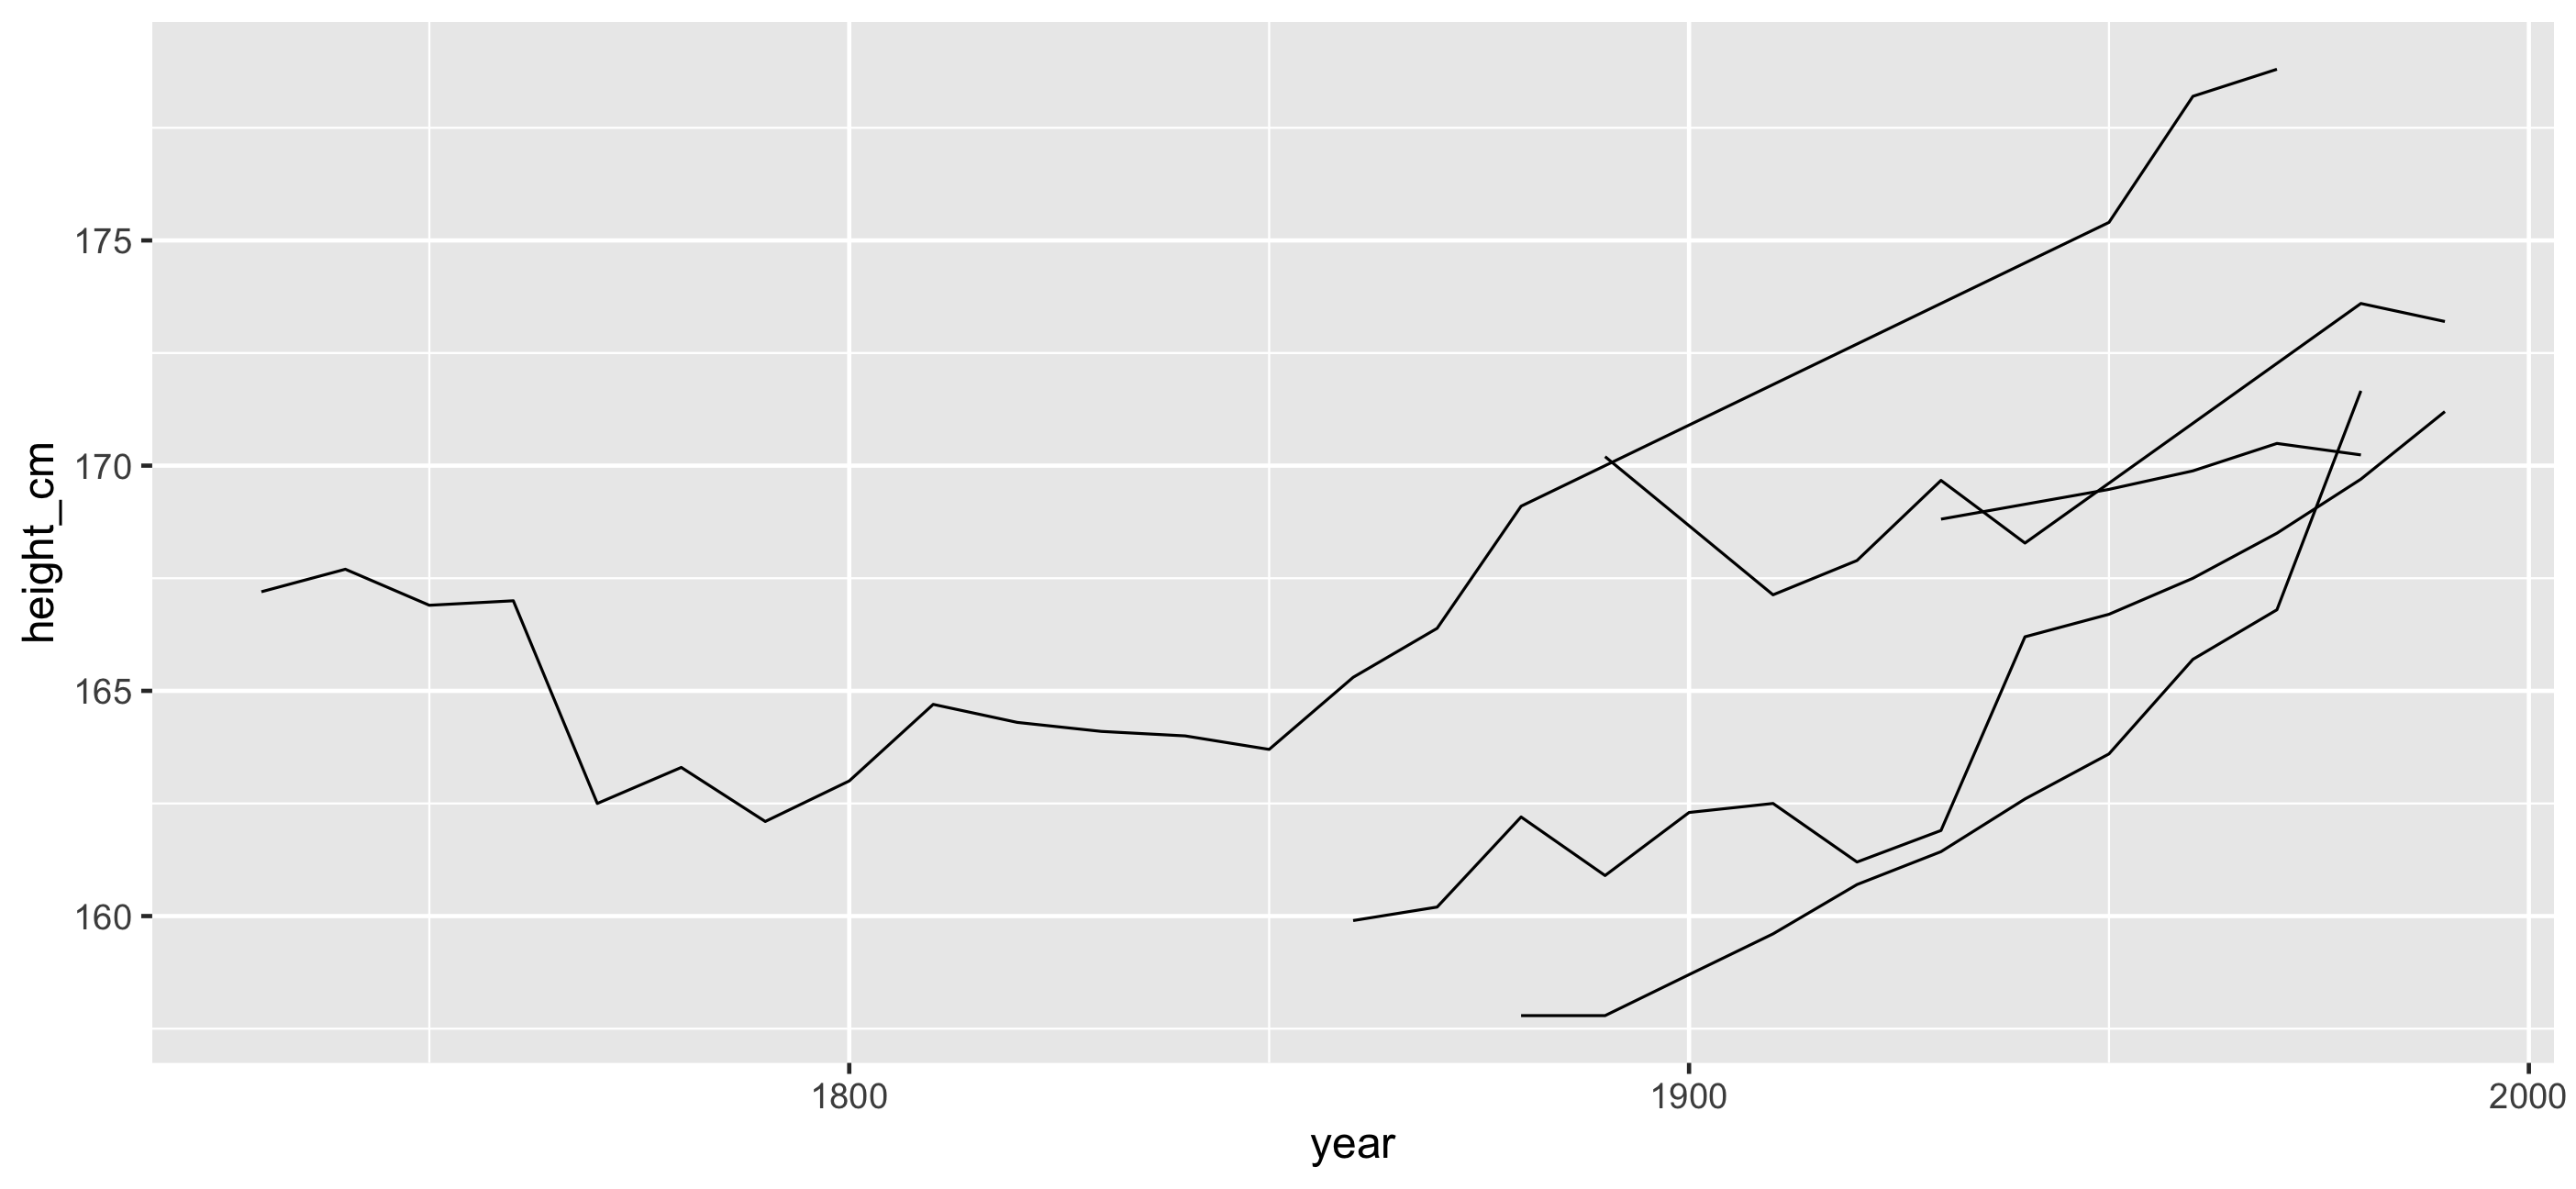
sample_n_keys() to sample ... keys
sample_n_keys(heights, 5)## # A tsibble: 56 x 3 [!]## # Key: country [5]## country year height_cm## <chr> <dbl> <dbl>## 1 Hungary 1730 167.## 2 Hungary 1740 168.## 3 Hungary 1750 167.## 4 Hungary 1760 167 ## 5 Hungary 1770 162.## 6 Hungary 1780 163.## # … with 50 more rowssample_n_keys() to sample ... keys
Problem #1: How do I look at some of the data?
Look at subsamples
Sample keys
Problem #1: How do I look at some of the data?
Look at subsamples
Sample keys
Look at many subsamples
Problem #1: How do I look at some of the data?
Look at subsamples
Sample keys
Look at many subsamples
?
Look at many subsamples
Look at many subsamples
Look at many subsamples
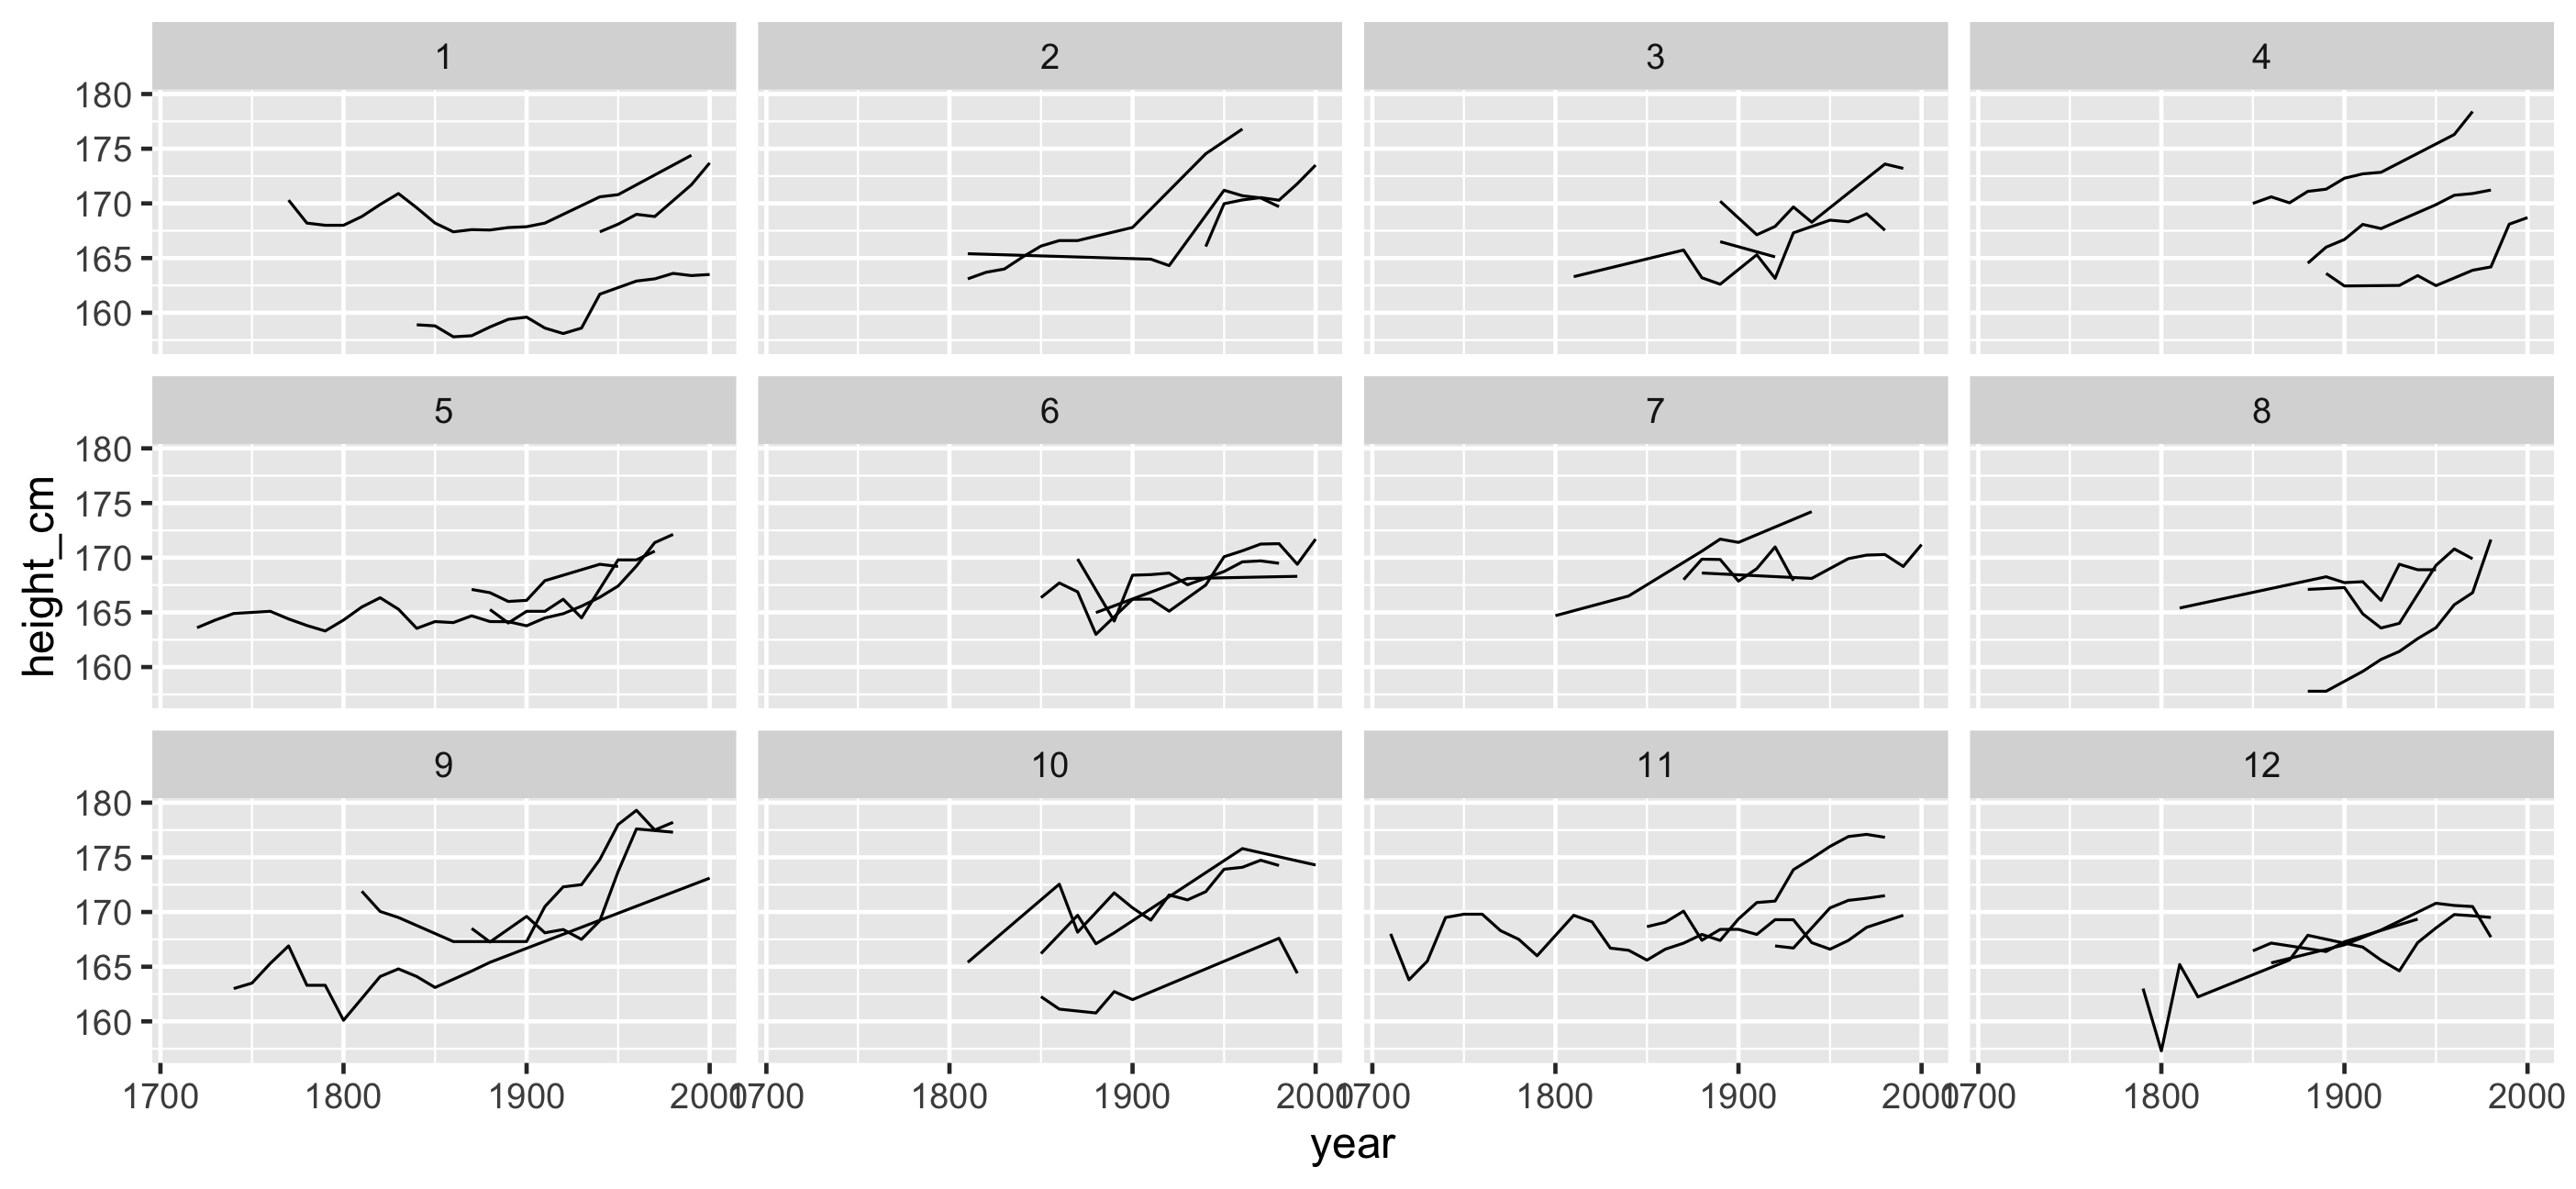
How to look at many subsamples
- How many facets to look at? (2, 4, ... 16?)
How to look at many subsamples
- How many facets to look at? (2, 4, ... 16?)
- How many keys per facets?
- 144 keys into 16 facets = 9 each
How to look at many subsamples
- How many facets to look at? (2, 4, ... 16?)
- How many keys per facets?
- 144 keys into 16 facets = 9 each
- Randomly pick 16 groups of size 9.
How to look at many subsamples
- How many facets to look at? (2, 4, ... 16?)
- How many keys per facets?
- 144 keys into 16 facets = 9 each
- Randomly pick 16 groups of size 9.
- This might not look like much extra work, but it hits the distraction threshold quite quickly.
Distraction threshold (time to rabbit hole)
Distraction threshold (time to rabbit hole)
(Something I made up)
Distraction threshold (time to rabbit hole)
(Something I made up)
If you have to solve 3+ substantial smaller problems in order to solve a larger problem, your focus shifts from the current goal to something else. You are distracted.
Task one
Task one being overshadowed slightly by minor task 1
- Task one being overshadowed slightly by minor task 2
- Task one being overshadowed slightly by minor task 3
Distraction threshold (time to rabbit hole)
I want to look at many subsamples of the data
Distraction threshold (time to rabbit hole)
I want to look at many subsamples of the data
How many keys are there?
Distraction threshold (time to rabbit hole)
I want to look at many subsamples of the data
How many keys are there?
How many facets do I want to look at
Distraction threshold (time to rabbit hole)
I want to look at many subsamples of the data
How many keys are there?
How many facets do I want to look at
How many keys per facet should I look at
Distraction threshold (time to rabbit hole)
I want to look at many subsamples of the data
How many keys are there?
How many facets do I want to look at
How many keys per facet should I look at
How do I ensure there are the same number of keys per plot
Distraction threshold (time to rabbit hole)
I want to look at many subsamples of the data
How many keys are there?
How many facets do I want to look at
How many keys per facet should I look at
How do I ensure there are the same number of keys per plot
What is rep, rep.int, and rep_len?
Distraction threshold (time to rabbit hole)
I want to look at many subsamples of the data
How many keys are there?
How many facets do I want to look at
How many keys per facet should I look at
How do I ensure there are the same number of keys per plot
What is rep, rep.int, and rep_len?
Do I want length.out or times?
Avoiding the rabbit hole
Avoiding the rabbit hole
We can blame ourselves when we are distracted for not being better.
Avoiding the rabbit hole
We can blame ourselves when we are distracted for not being better.
It's not that we should be better, rather with better tools we could be more efficient.
Avoiding the rabbit hole
We can blame ourselves when we are distracted for not being better.
It's not that we should be better, rather with better tools we could be more efficient.
We need to make things as easy as reasonable, with the least amount of distraction.
Removing the distraction threshold means asking the most relevant question
Removing the distraction threshold means asking the most relevant question
How many plots do I want to look at?
Removing the distraction threshold means asking the most relevant question
How many plots do I want to look at?
heights_plot + facet_sample( n_per_facet = 3, n_facets = 9 )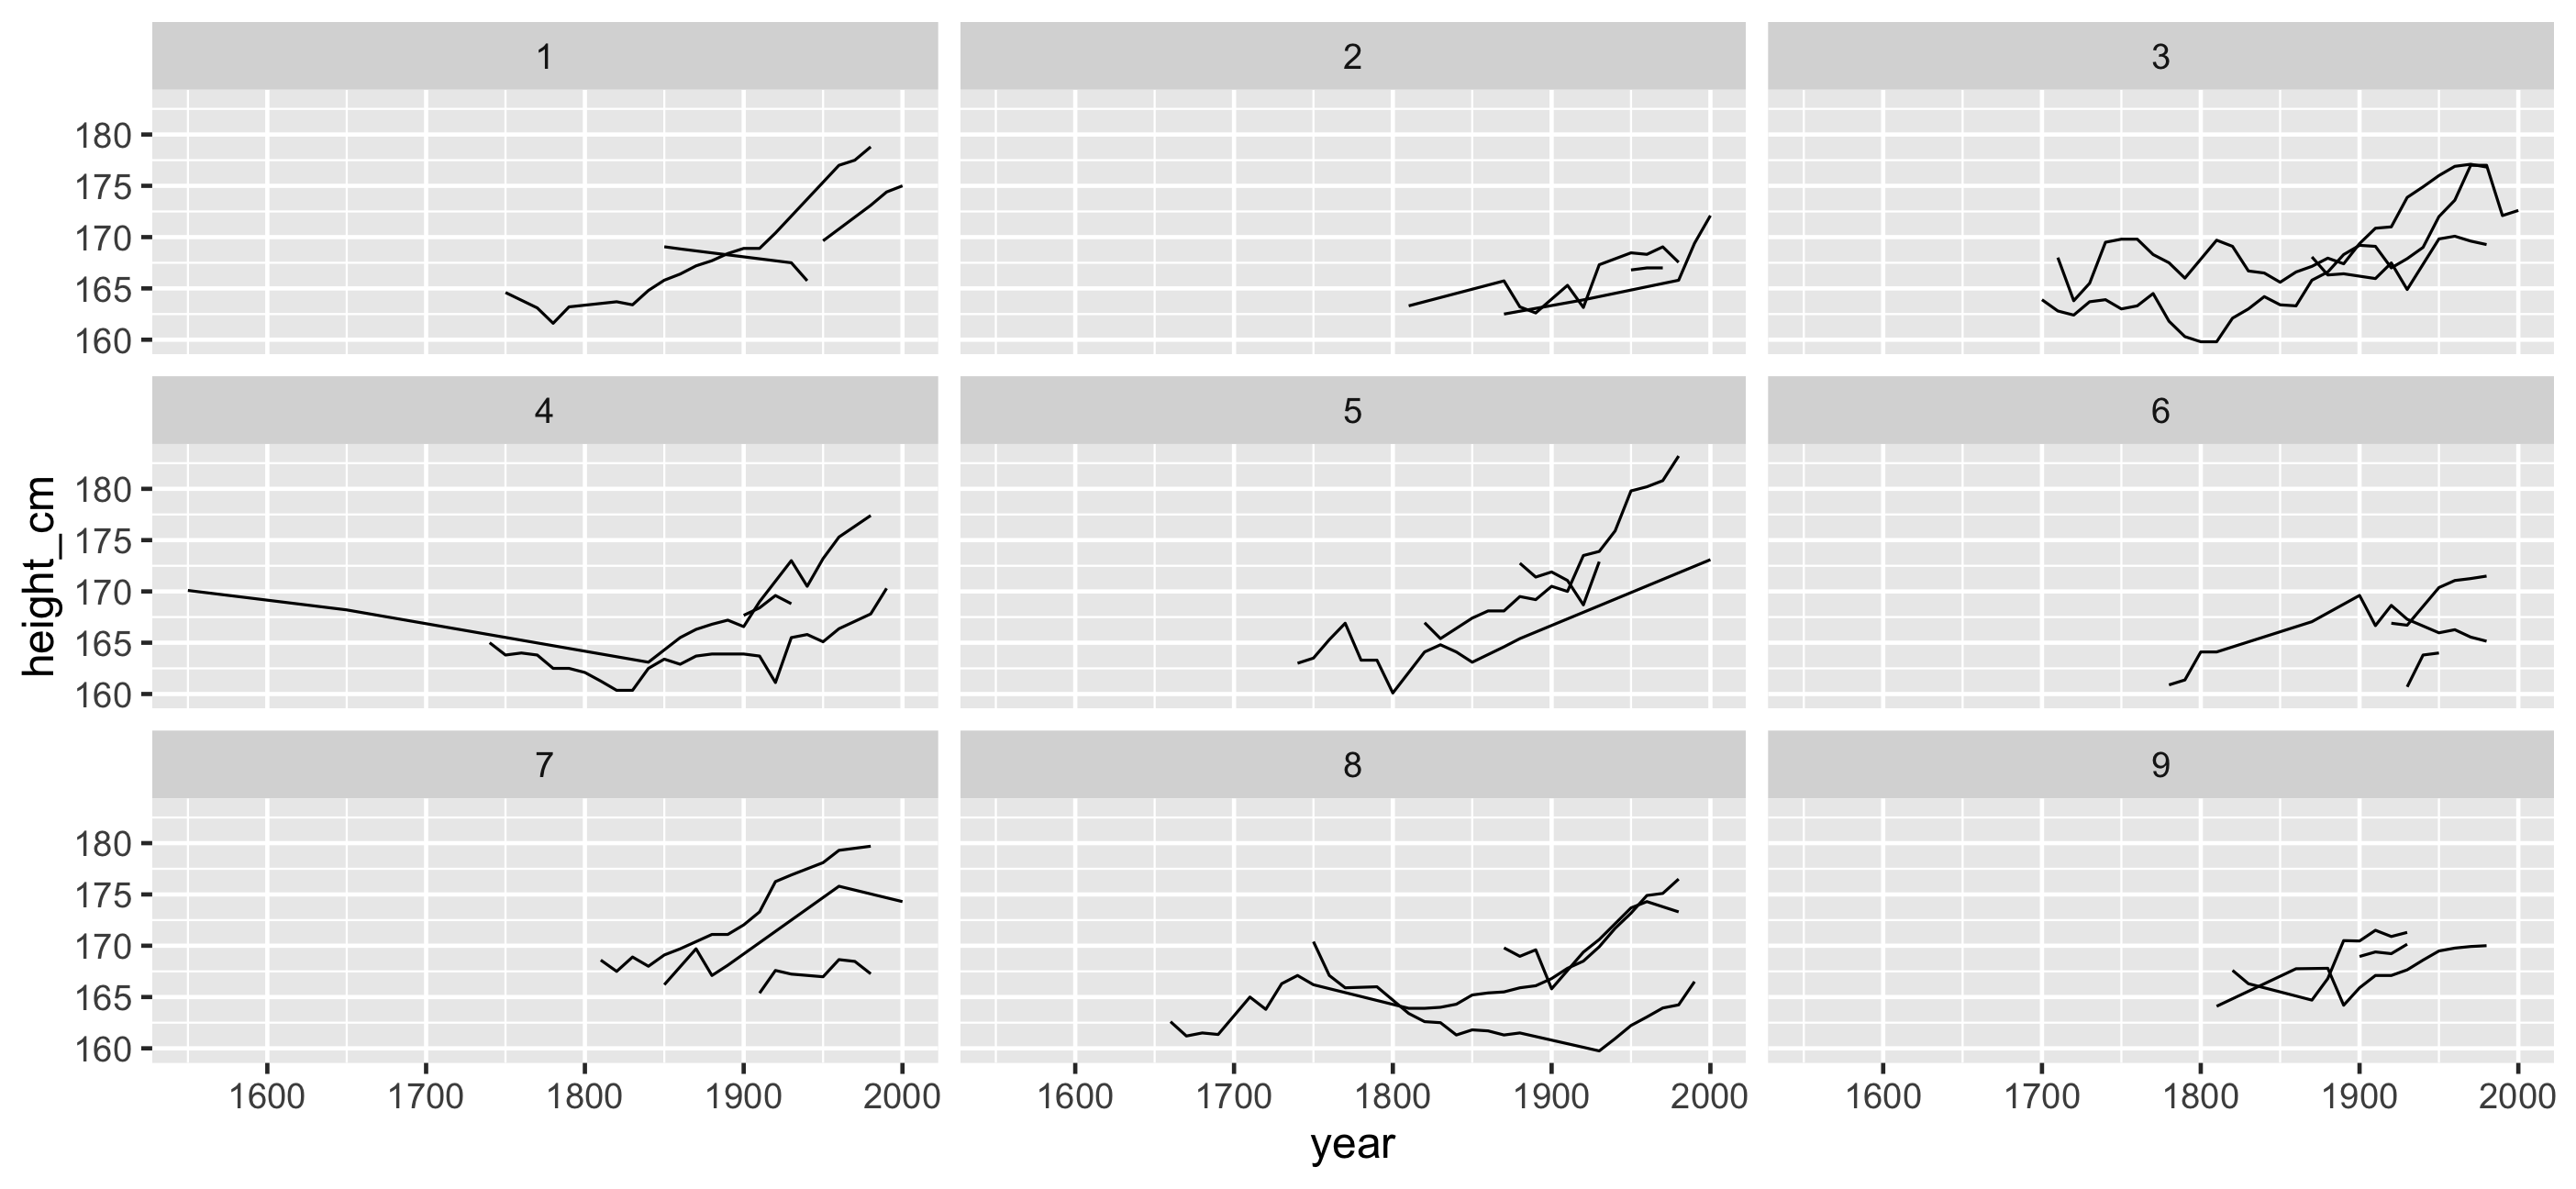
facet_sample(): See more individuals
ggplot(heights, aes(x = year, y = height_cm, group = country)) + geom_line()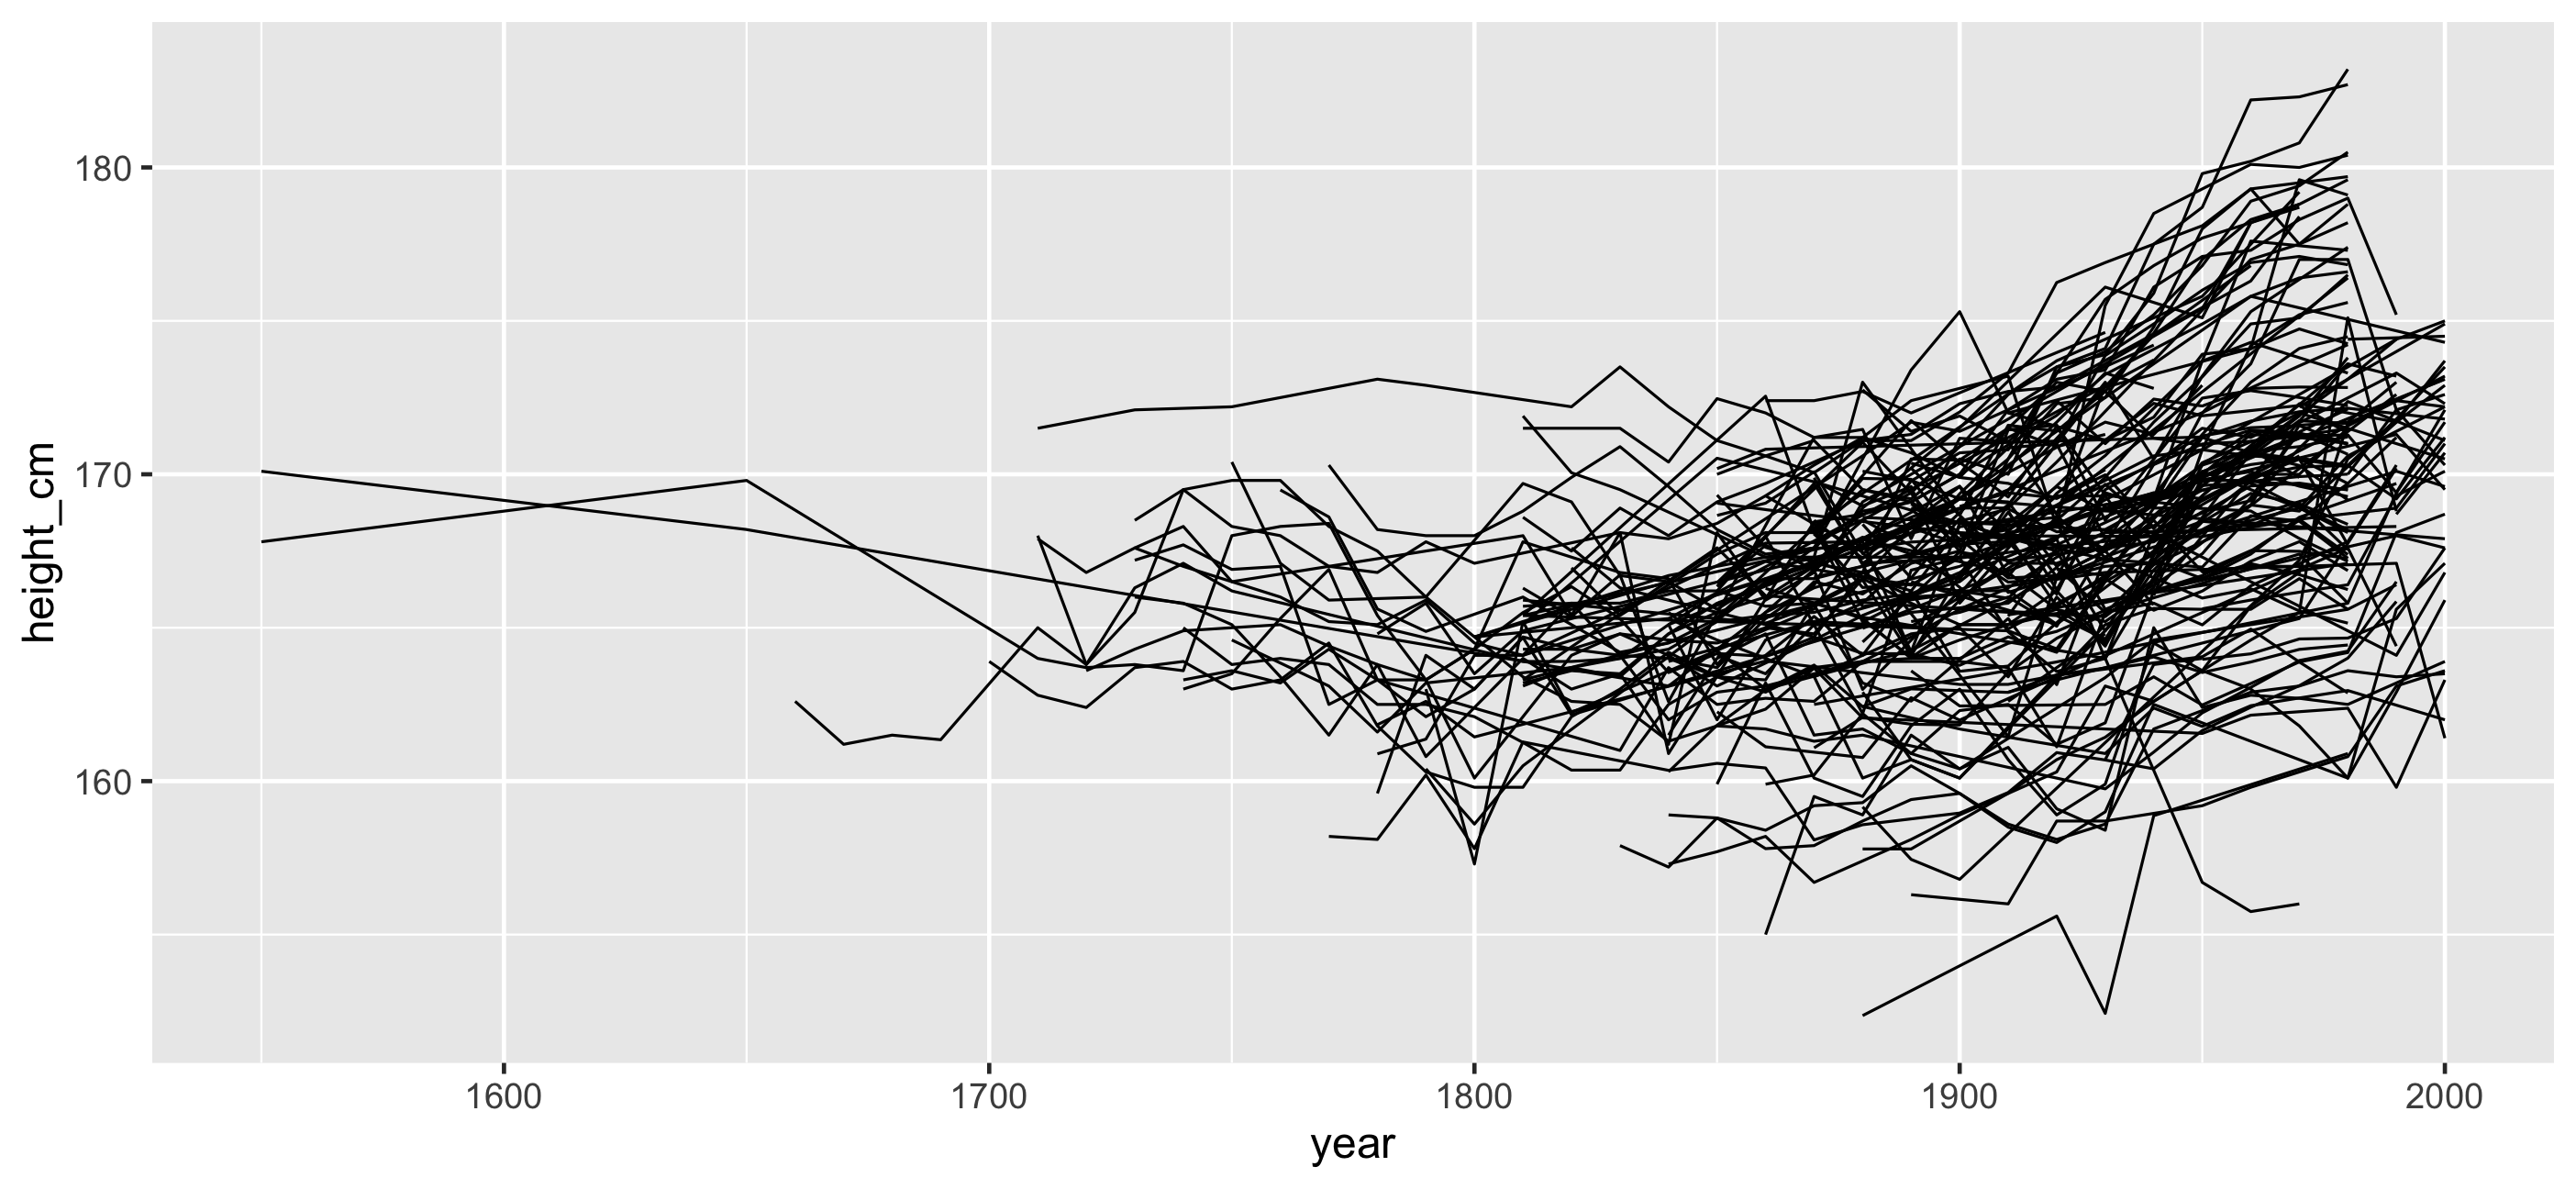
facet_sample(): See more individuals
ggplot(heights, aes(x = year, y = height_cm, group = country)) + geom_line() + facet_sample()facet_sample(): See more individuals
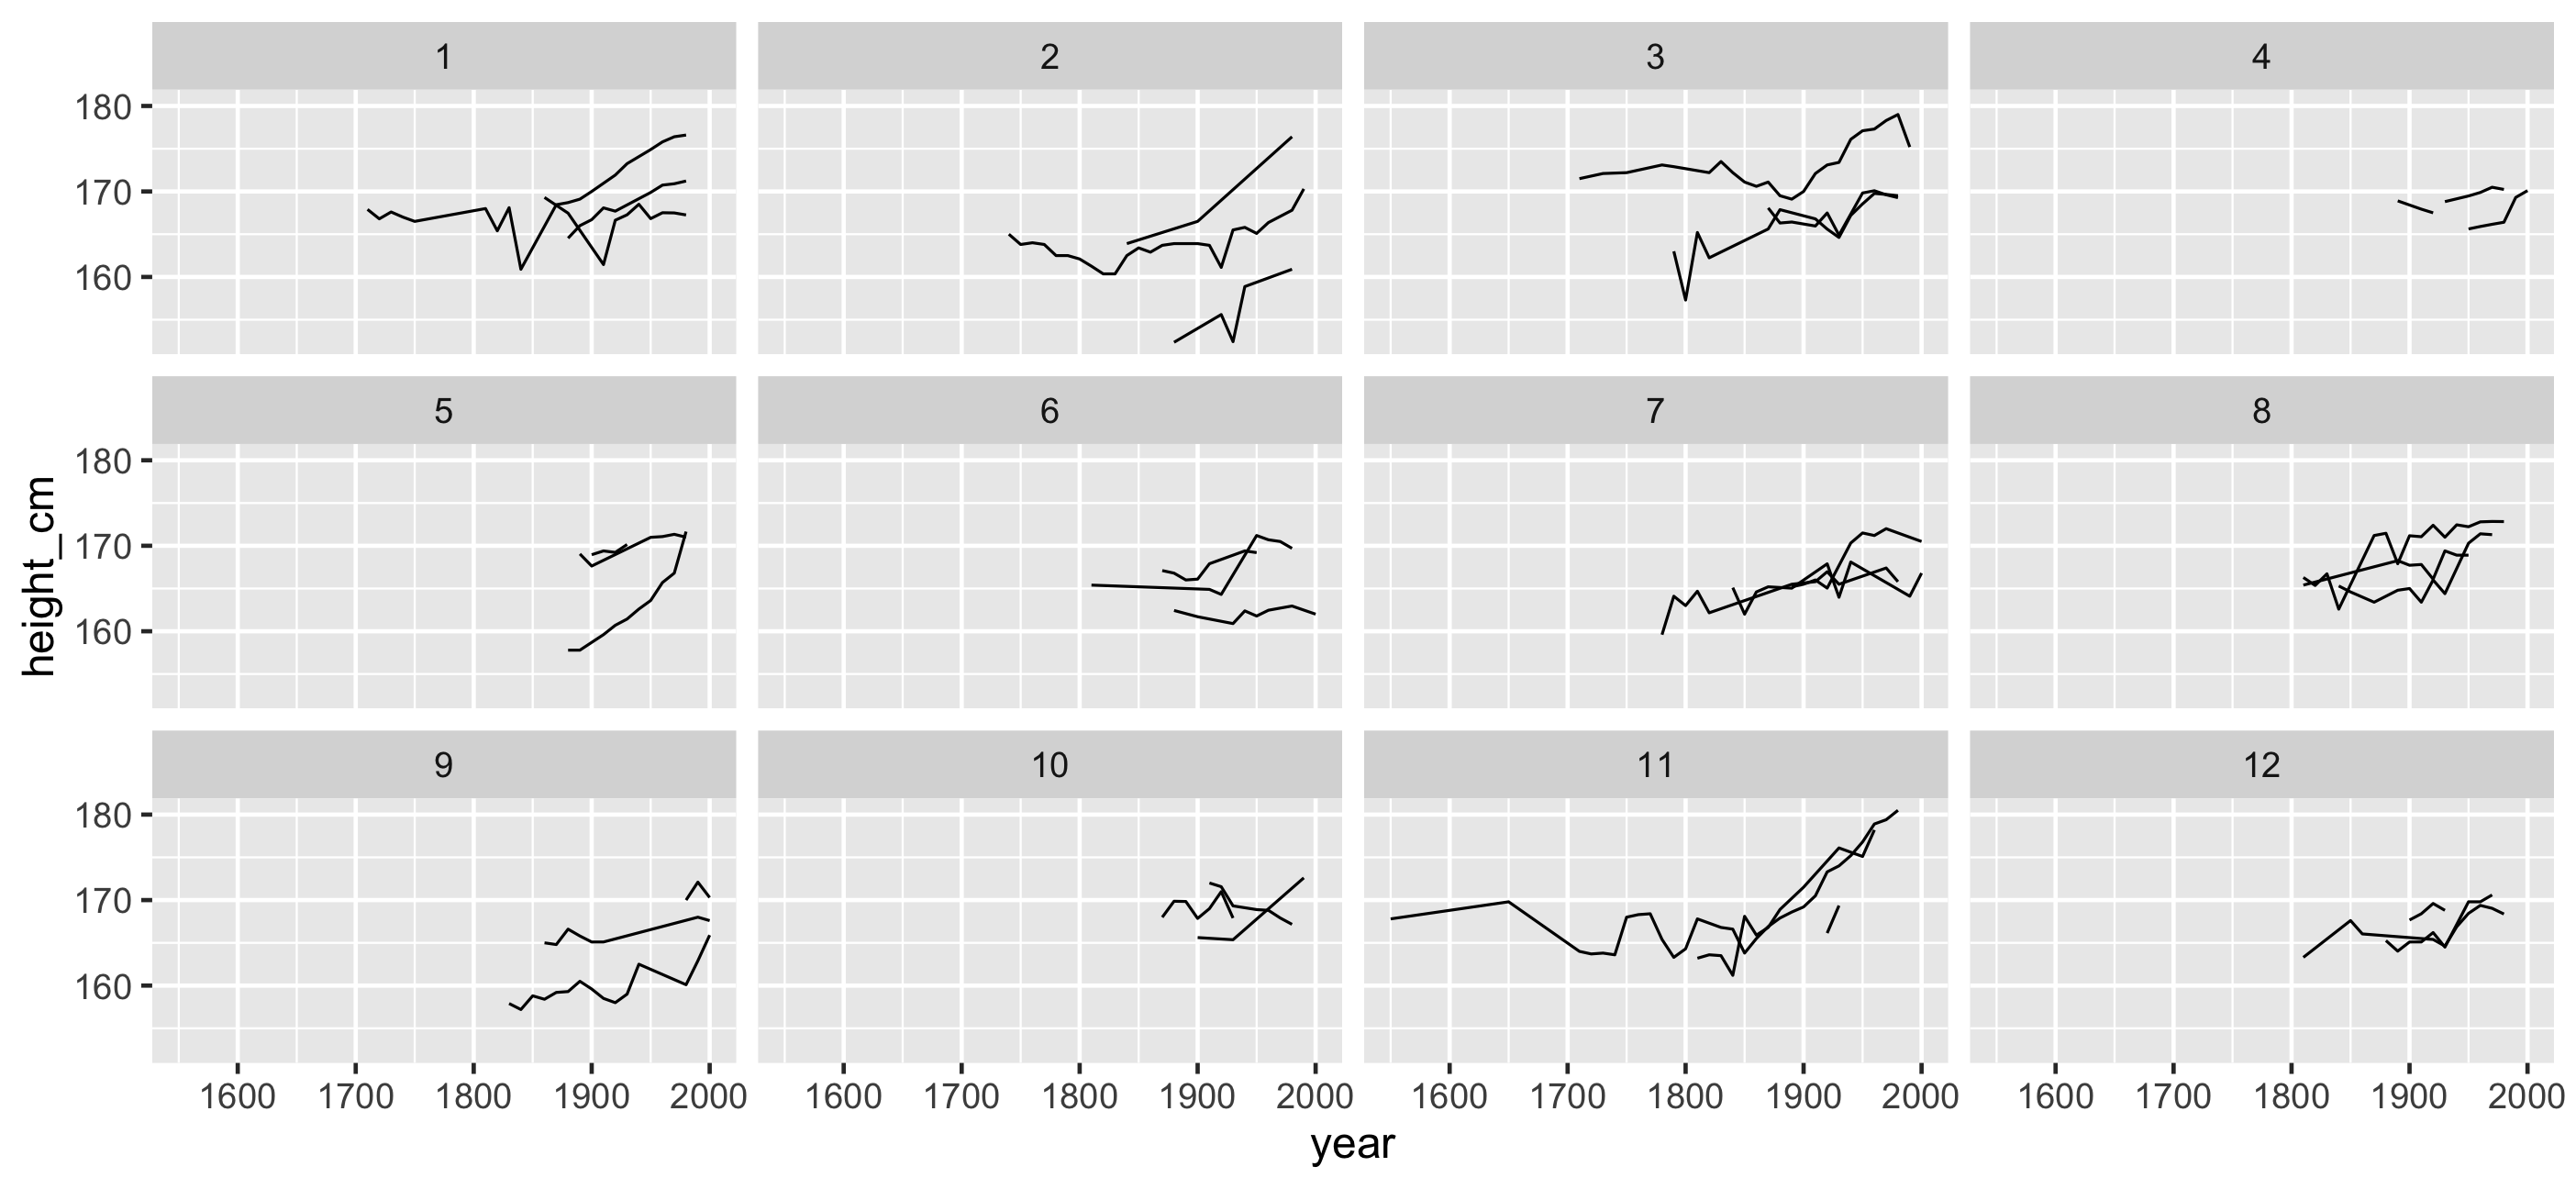
facet_strata(): See all individuals
ggplot(heights, aes(x = year, y = height_cm, group = country)) + geom_line() + facet_strata()facet_strata(): See all individuals
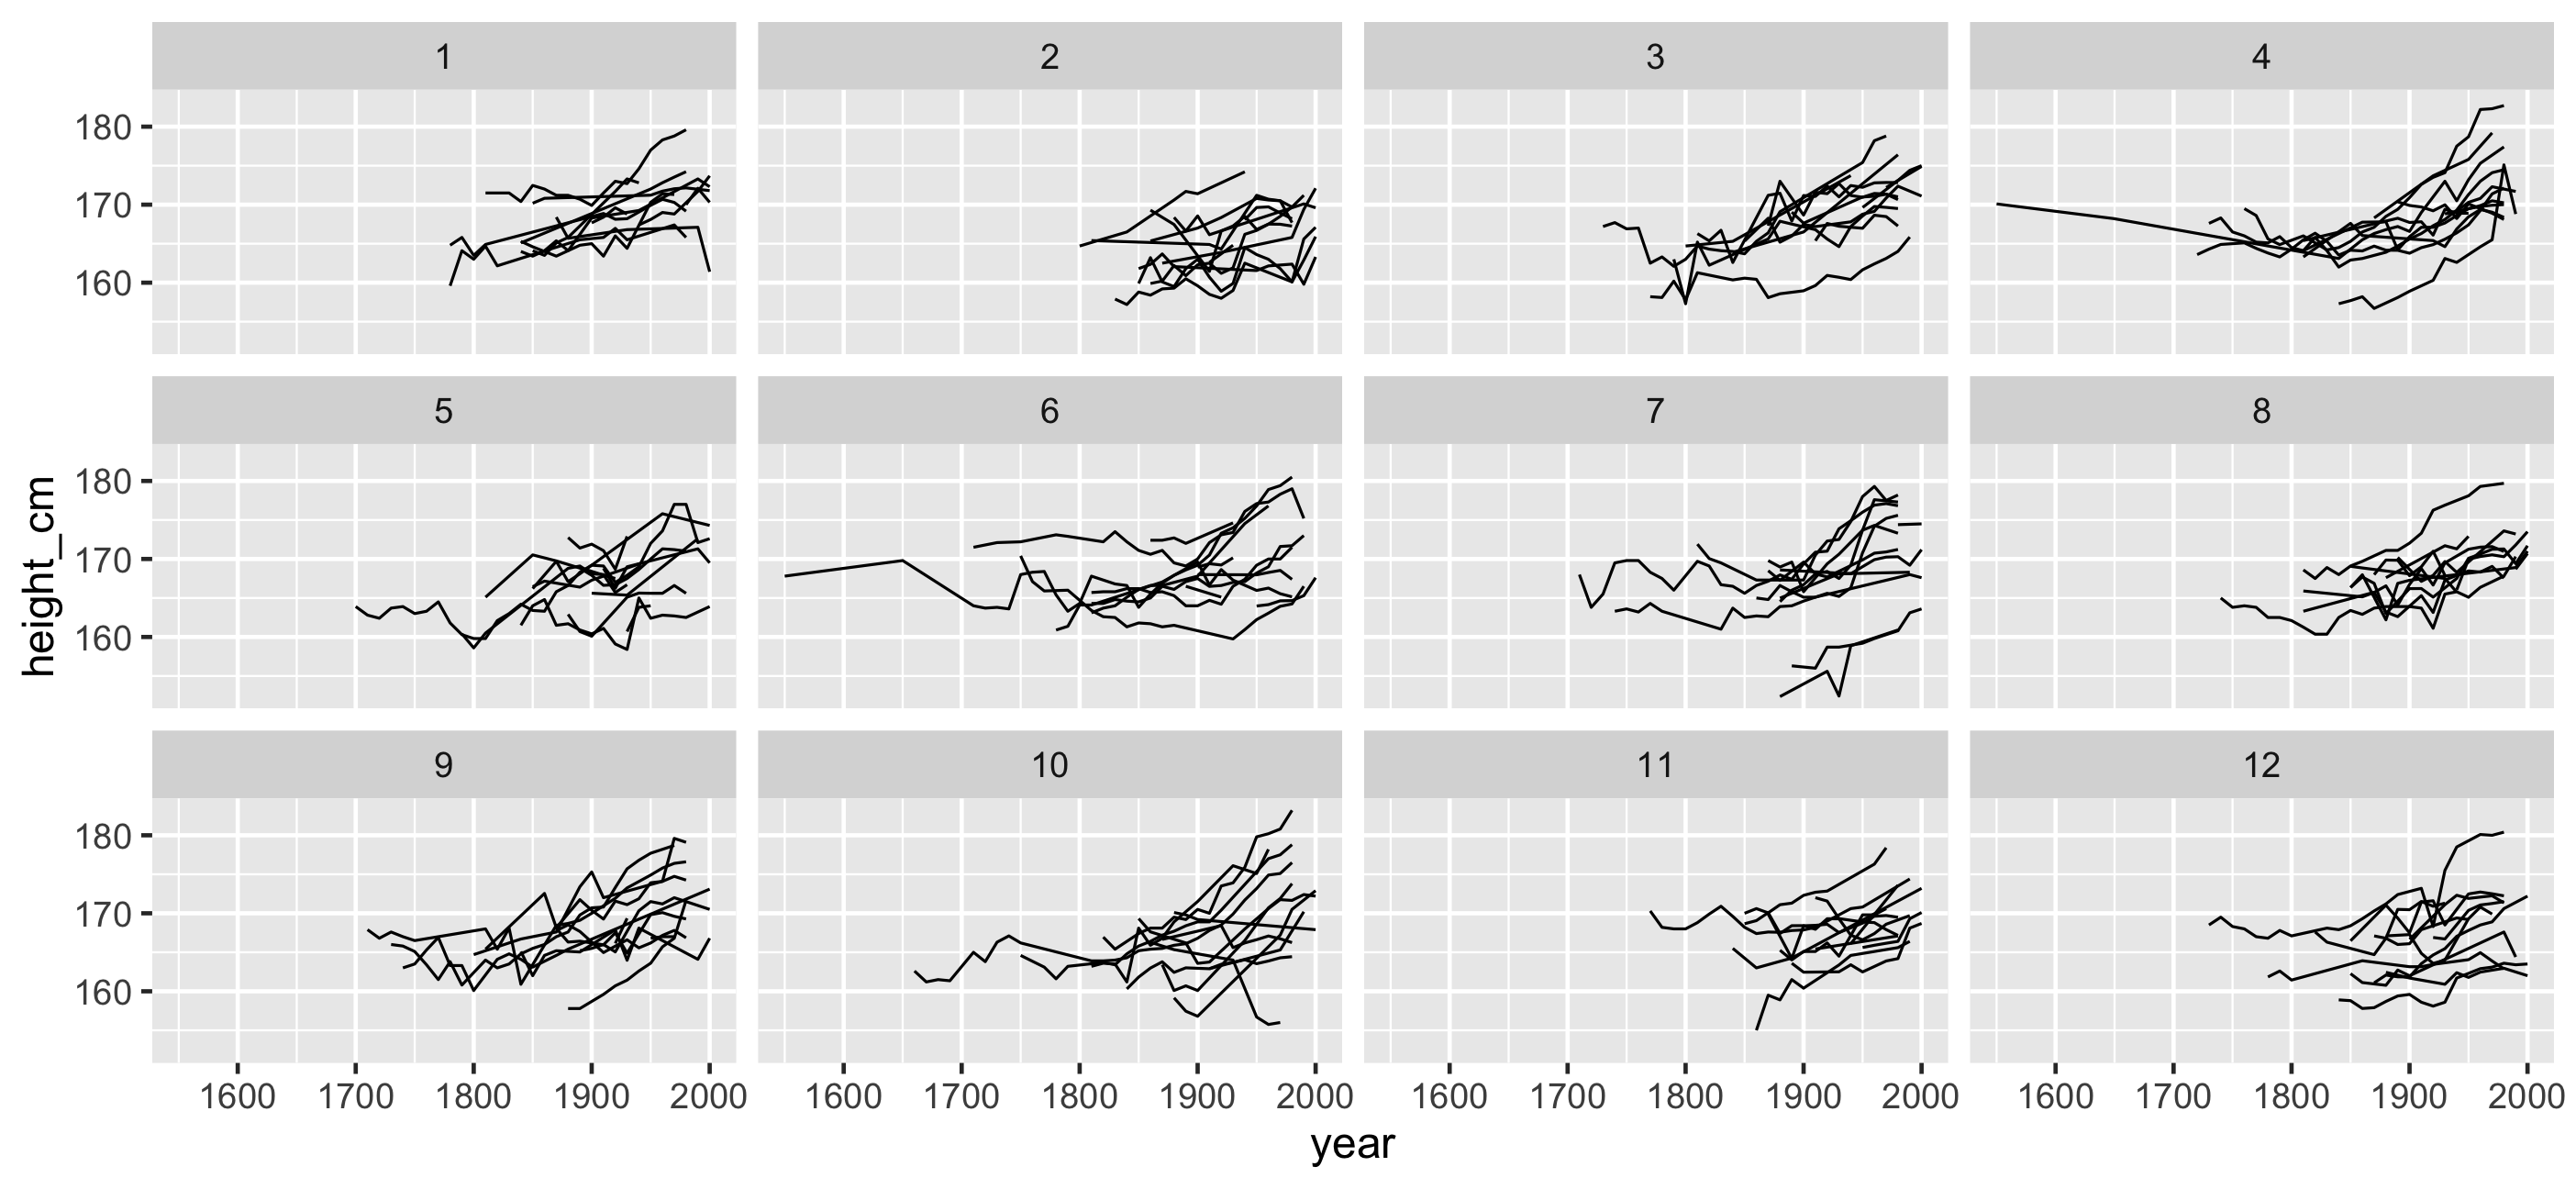
Can we re-order these facets in a meaningful way?
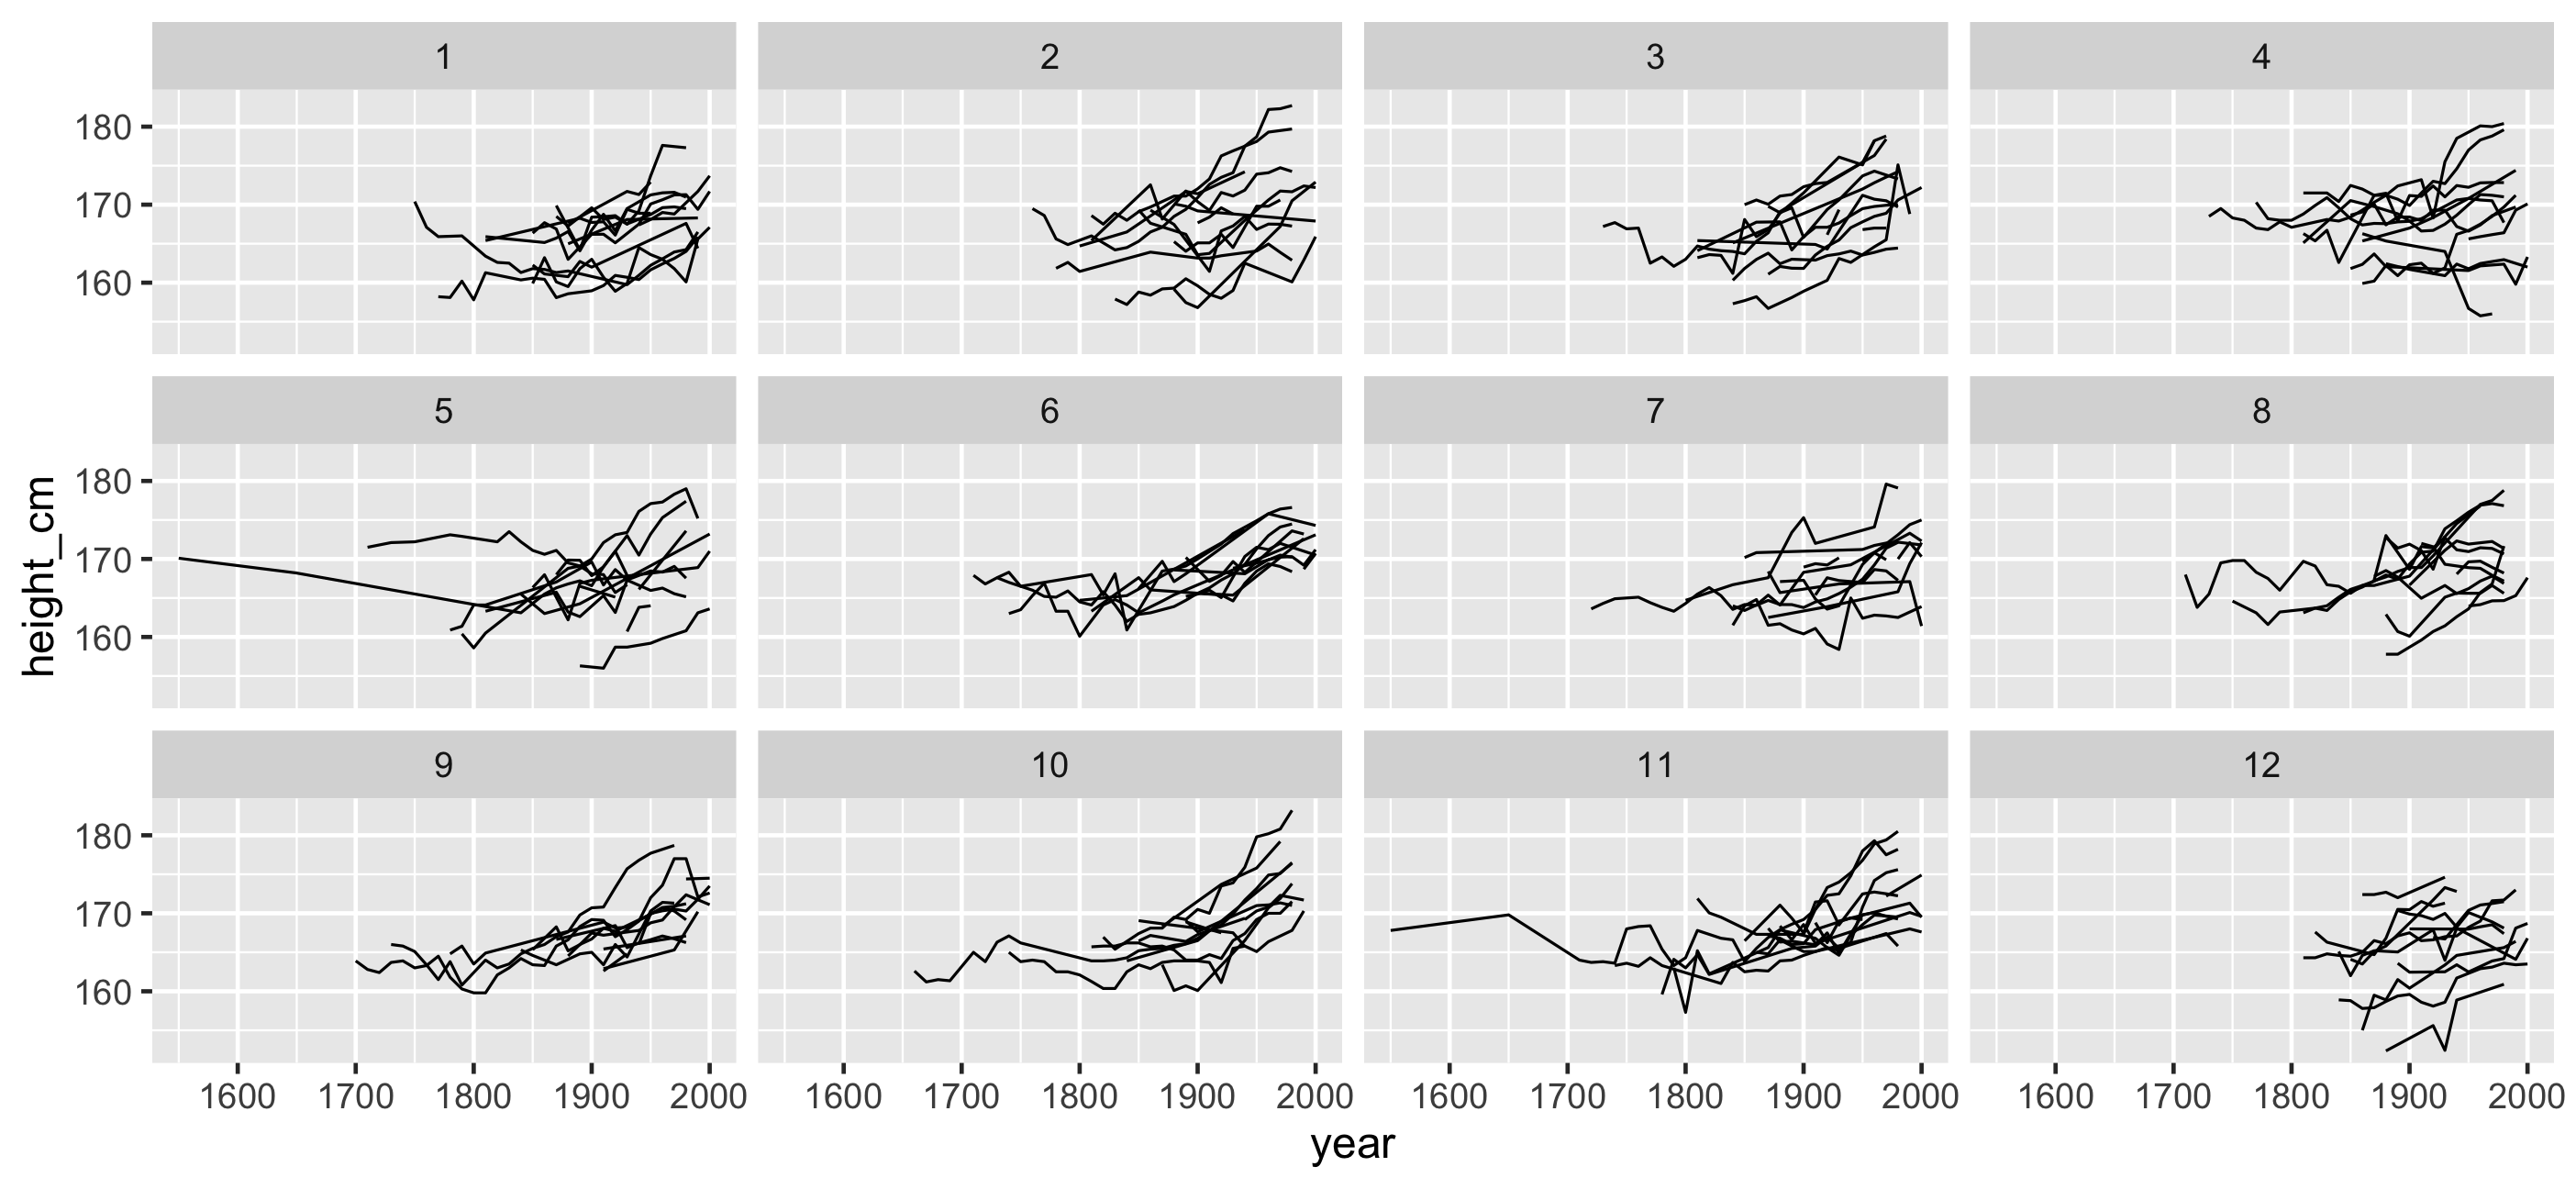
In asking these questions we can solve something else interesting
facet_strata(along = -year): see all individuals along some variable
ggplot(heights, aes(x = year, y = height_cm, group = country)) + geom_line() + facet_strata(along = -year)facet_strata(along = -year): see all individuals along some variable
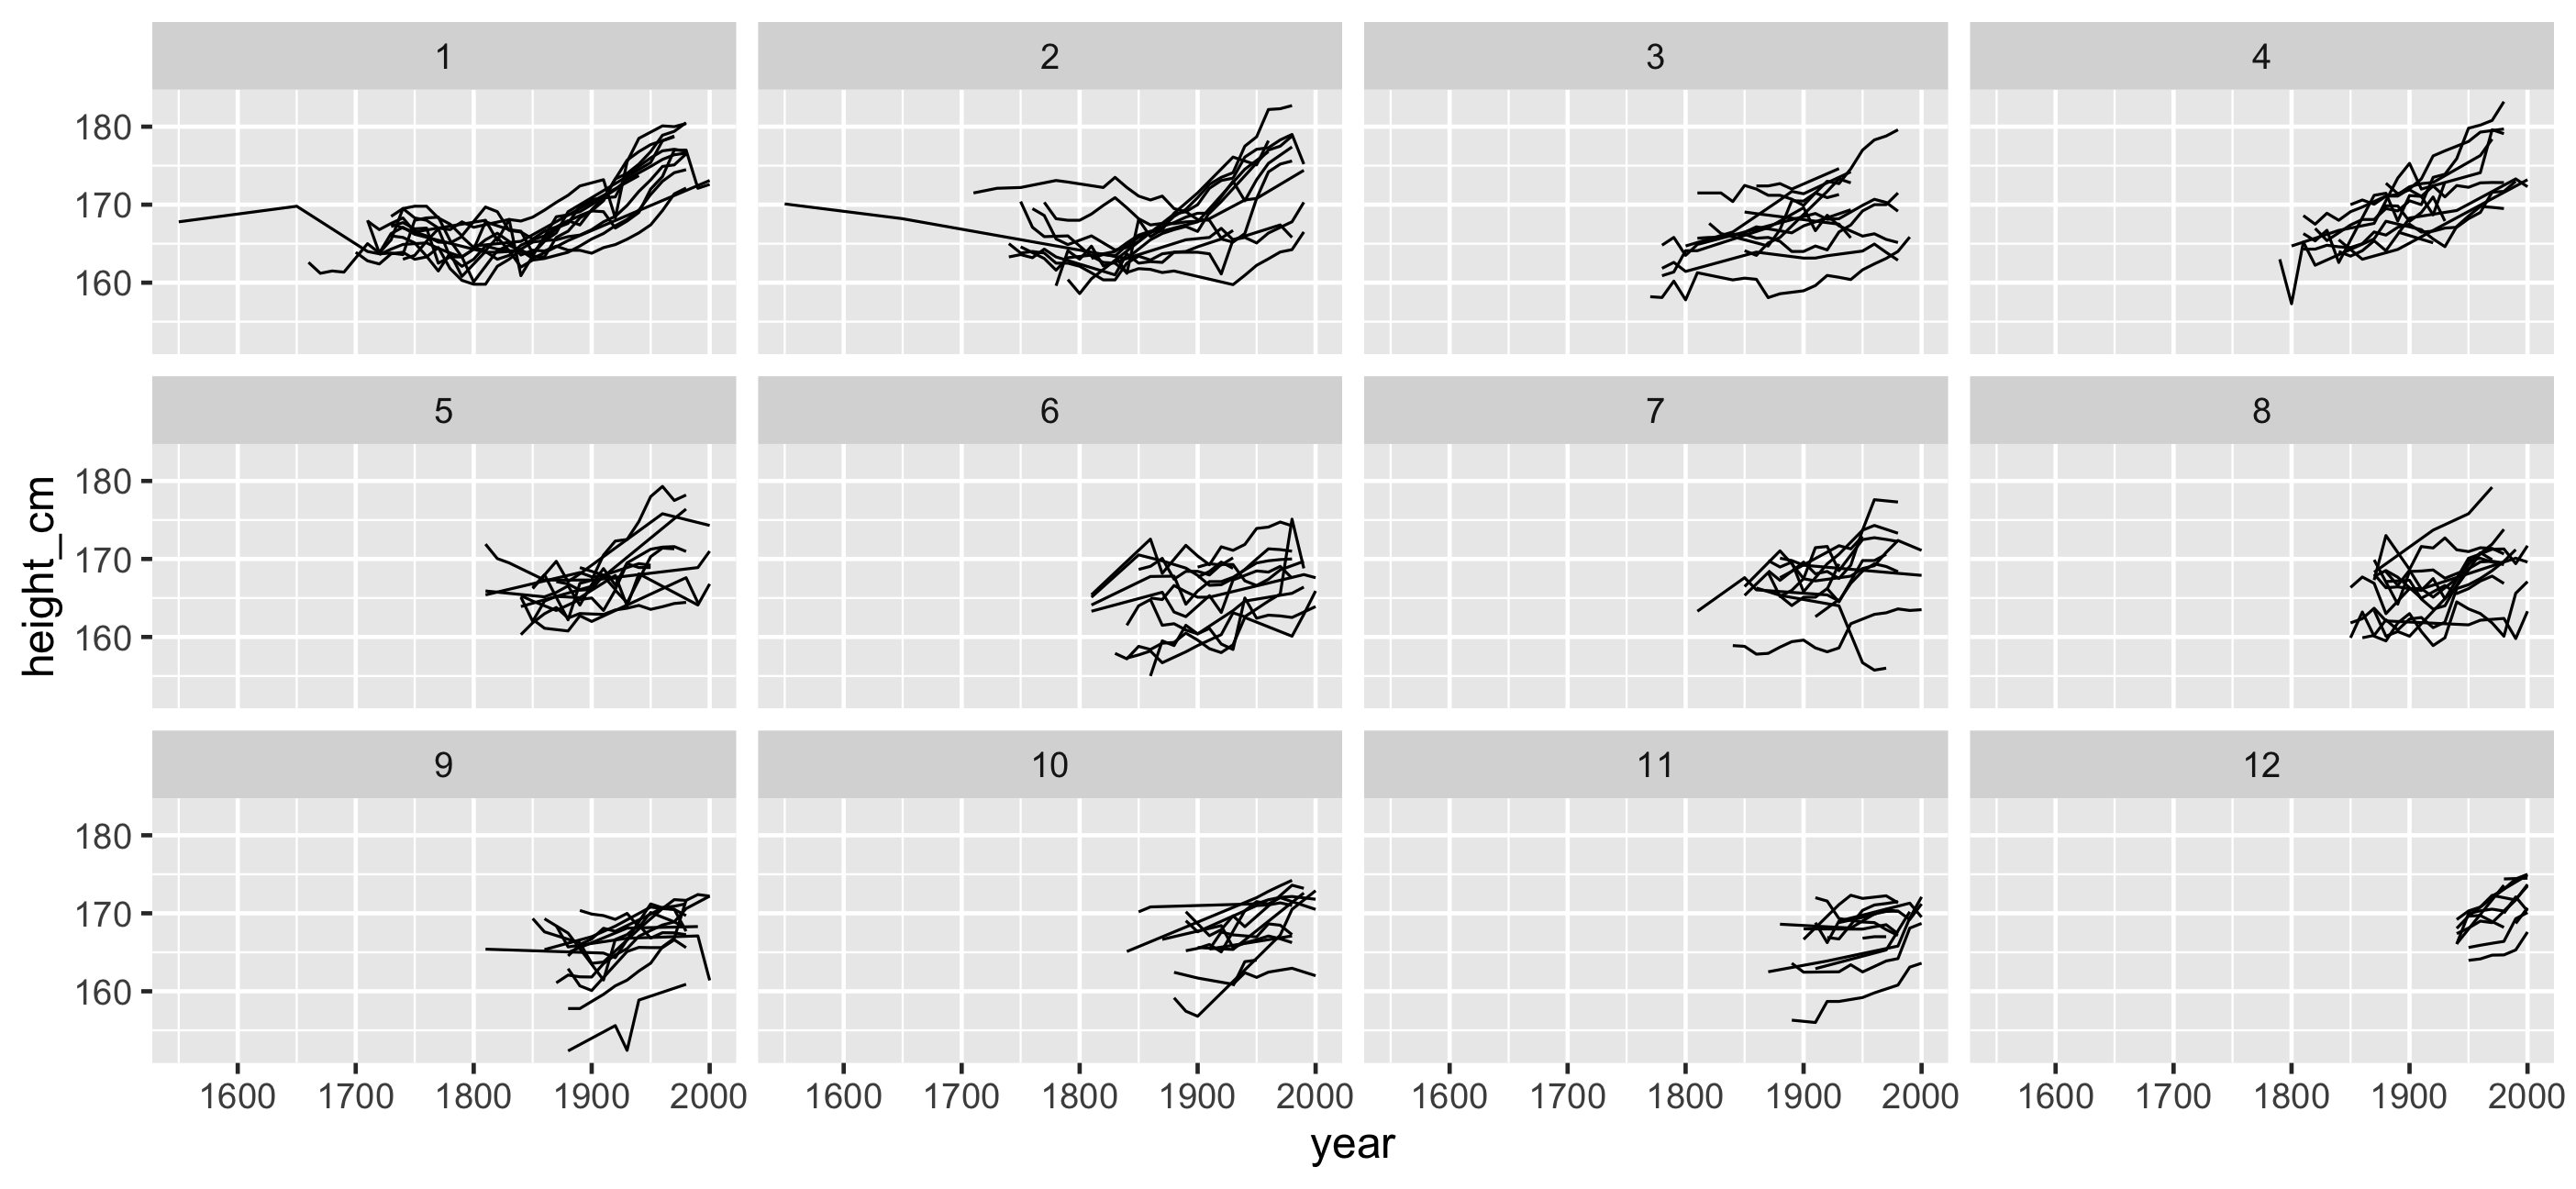
Focus on answering relevant questions instead of the minutae:
"How many lines per facet"
"How many facets?"
ggplot + facet_sample( n_per_facet = 10, n_facets = 12 )Focus on answering relevant questions instead of the minutae:
"How many lines per facet"
"How many facets?"
ggplot + facet_sample( n_per_facet = 10, n_facets = 12 )"How many facets to shove all the data in?"
ggplot + facet_strata( n_strata = 10, )facet_strata() & facet_sample() Under the hood
using sample_n_keys() & stratify_keys()
facet_strata() & facet_sample() Under the hood
using sample_n_keys() & stratify_keys()
You can still get at data and do manipulations
Problem #1: How do I look at some of the data?
Problem #1: How do I look at some of the data?
as_tsibble()
sample_n_keys()
facet_sample()
facet_strata()
Problem #1: How do I look at some of the data?
as_tsibble()
sample_n_keys()
facet_sample()
facet_strata()
Store useful information
View subsamples of data
View many subsamples
View all subsamples
Problem #1: How do I look at some of the data?
as_tsibble()
sample_n_keys()
facet_sample()
facet_strata()
Store useful information
View subsamples of data
View many subsamples
View all subsamples
Problem #2: How do I find interesting observations?
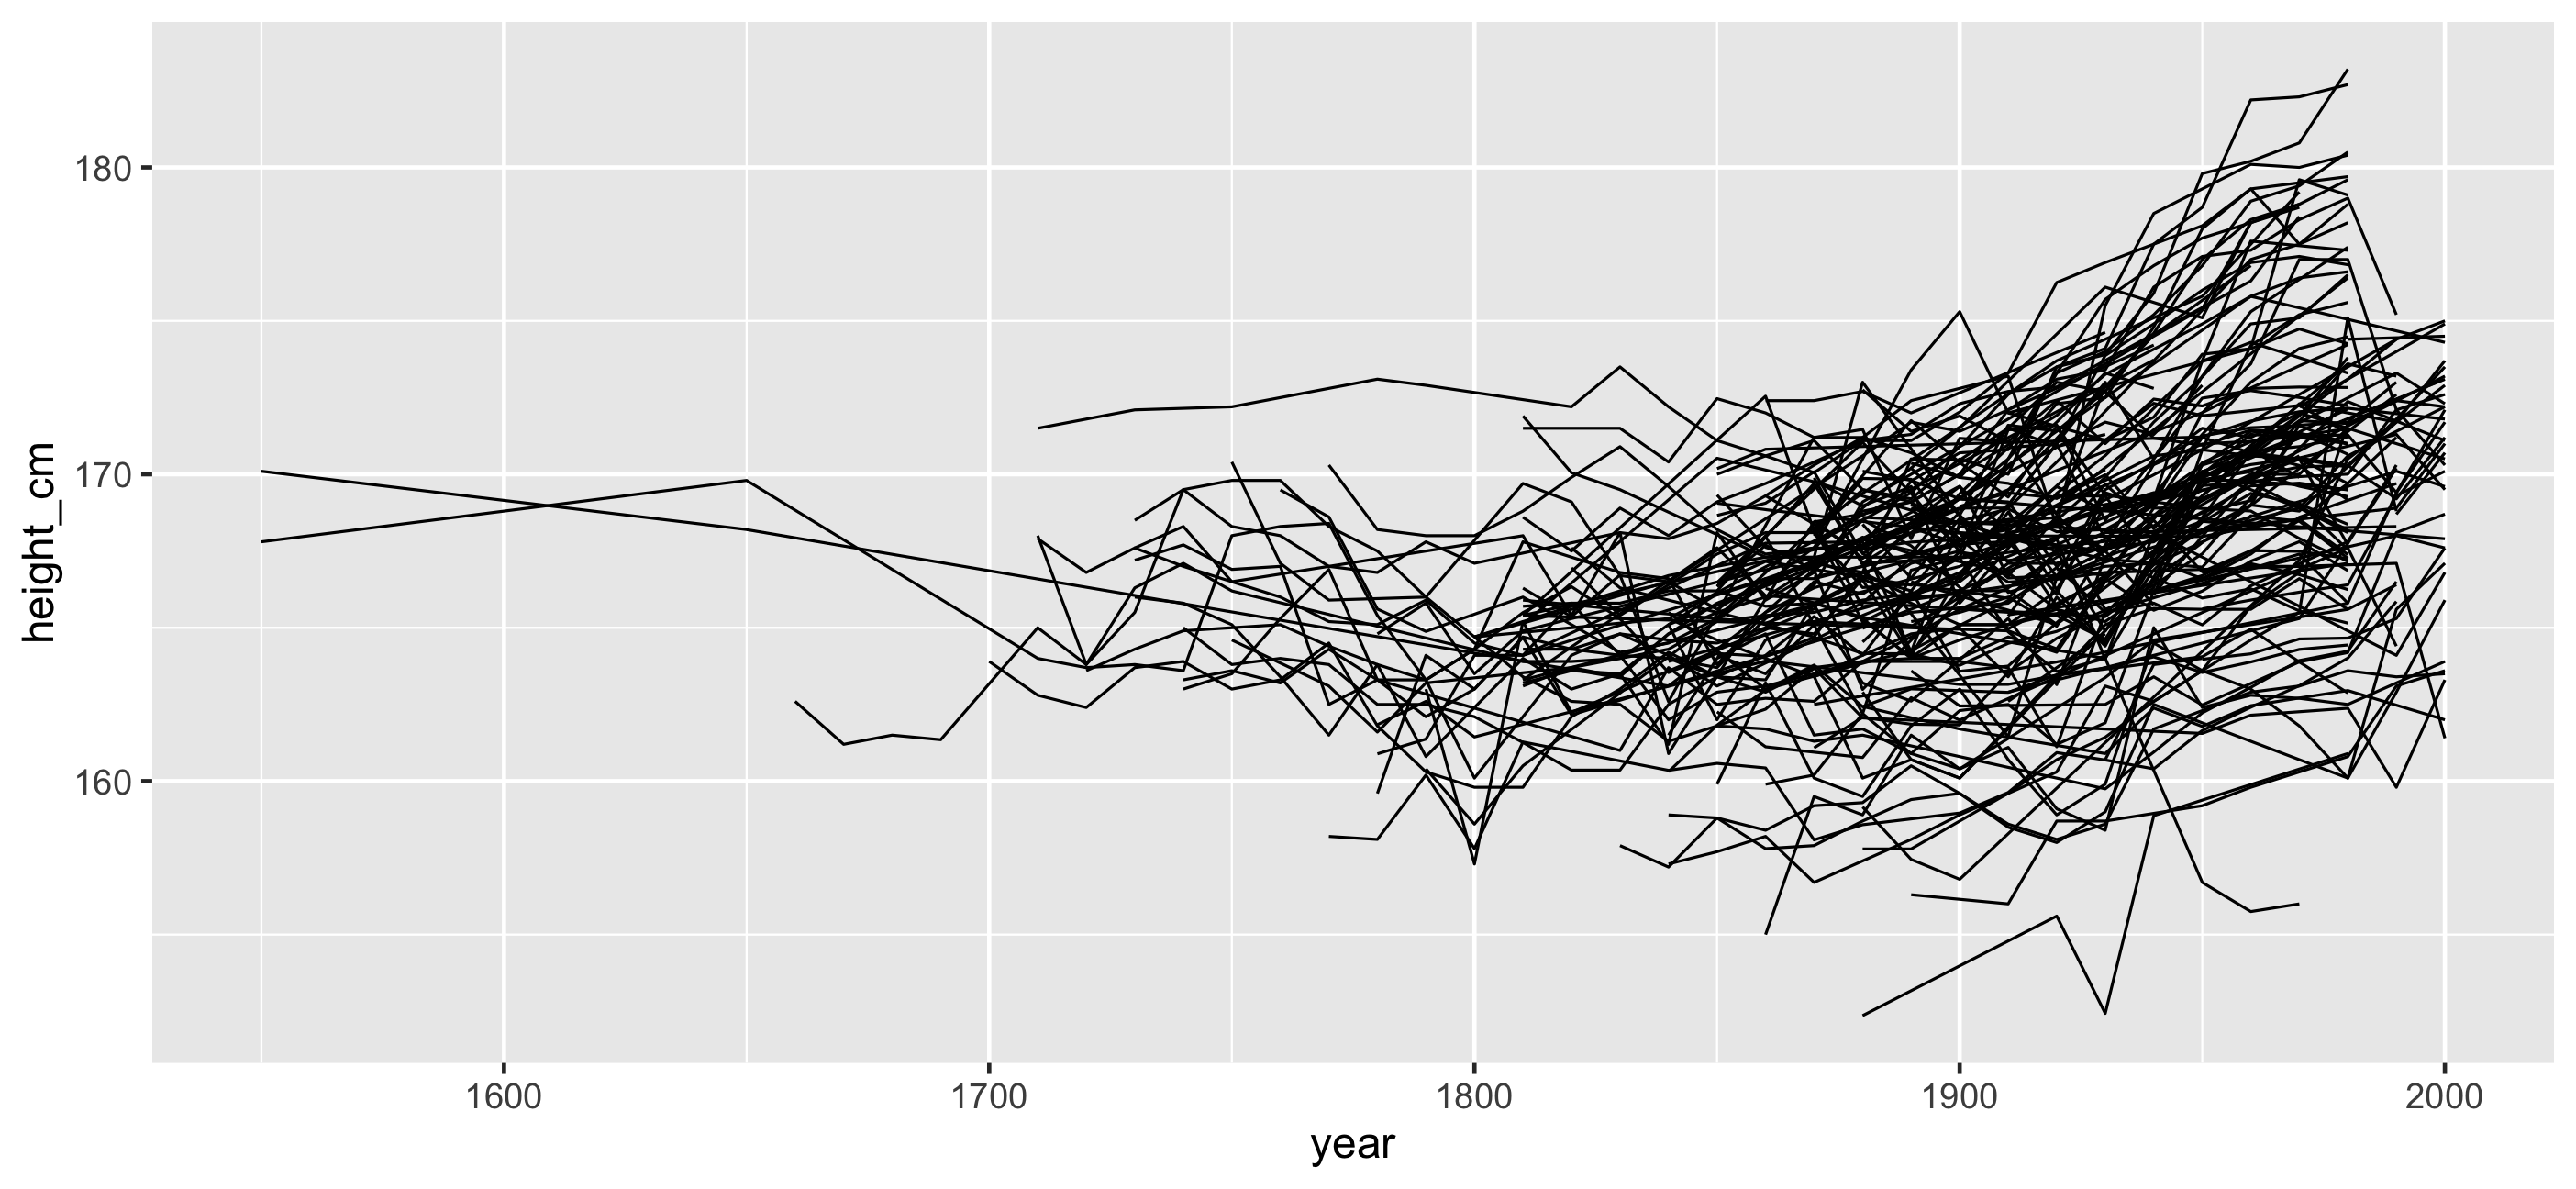
Problem #2: How do I find interesting observations?
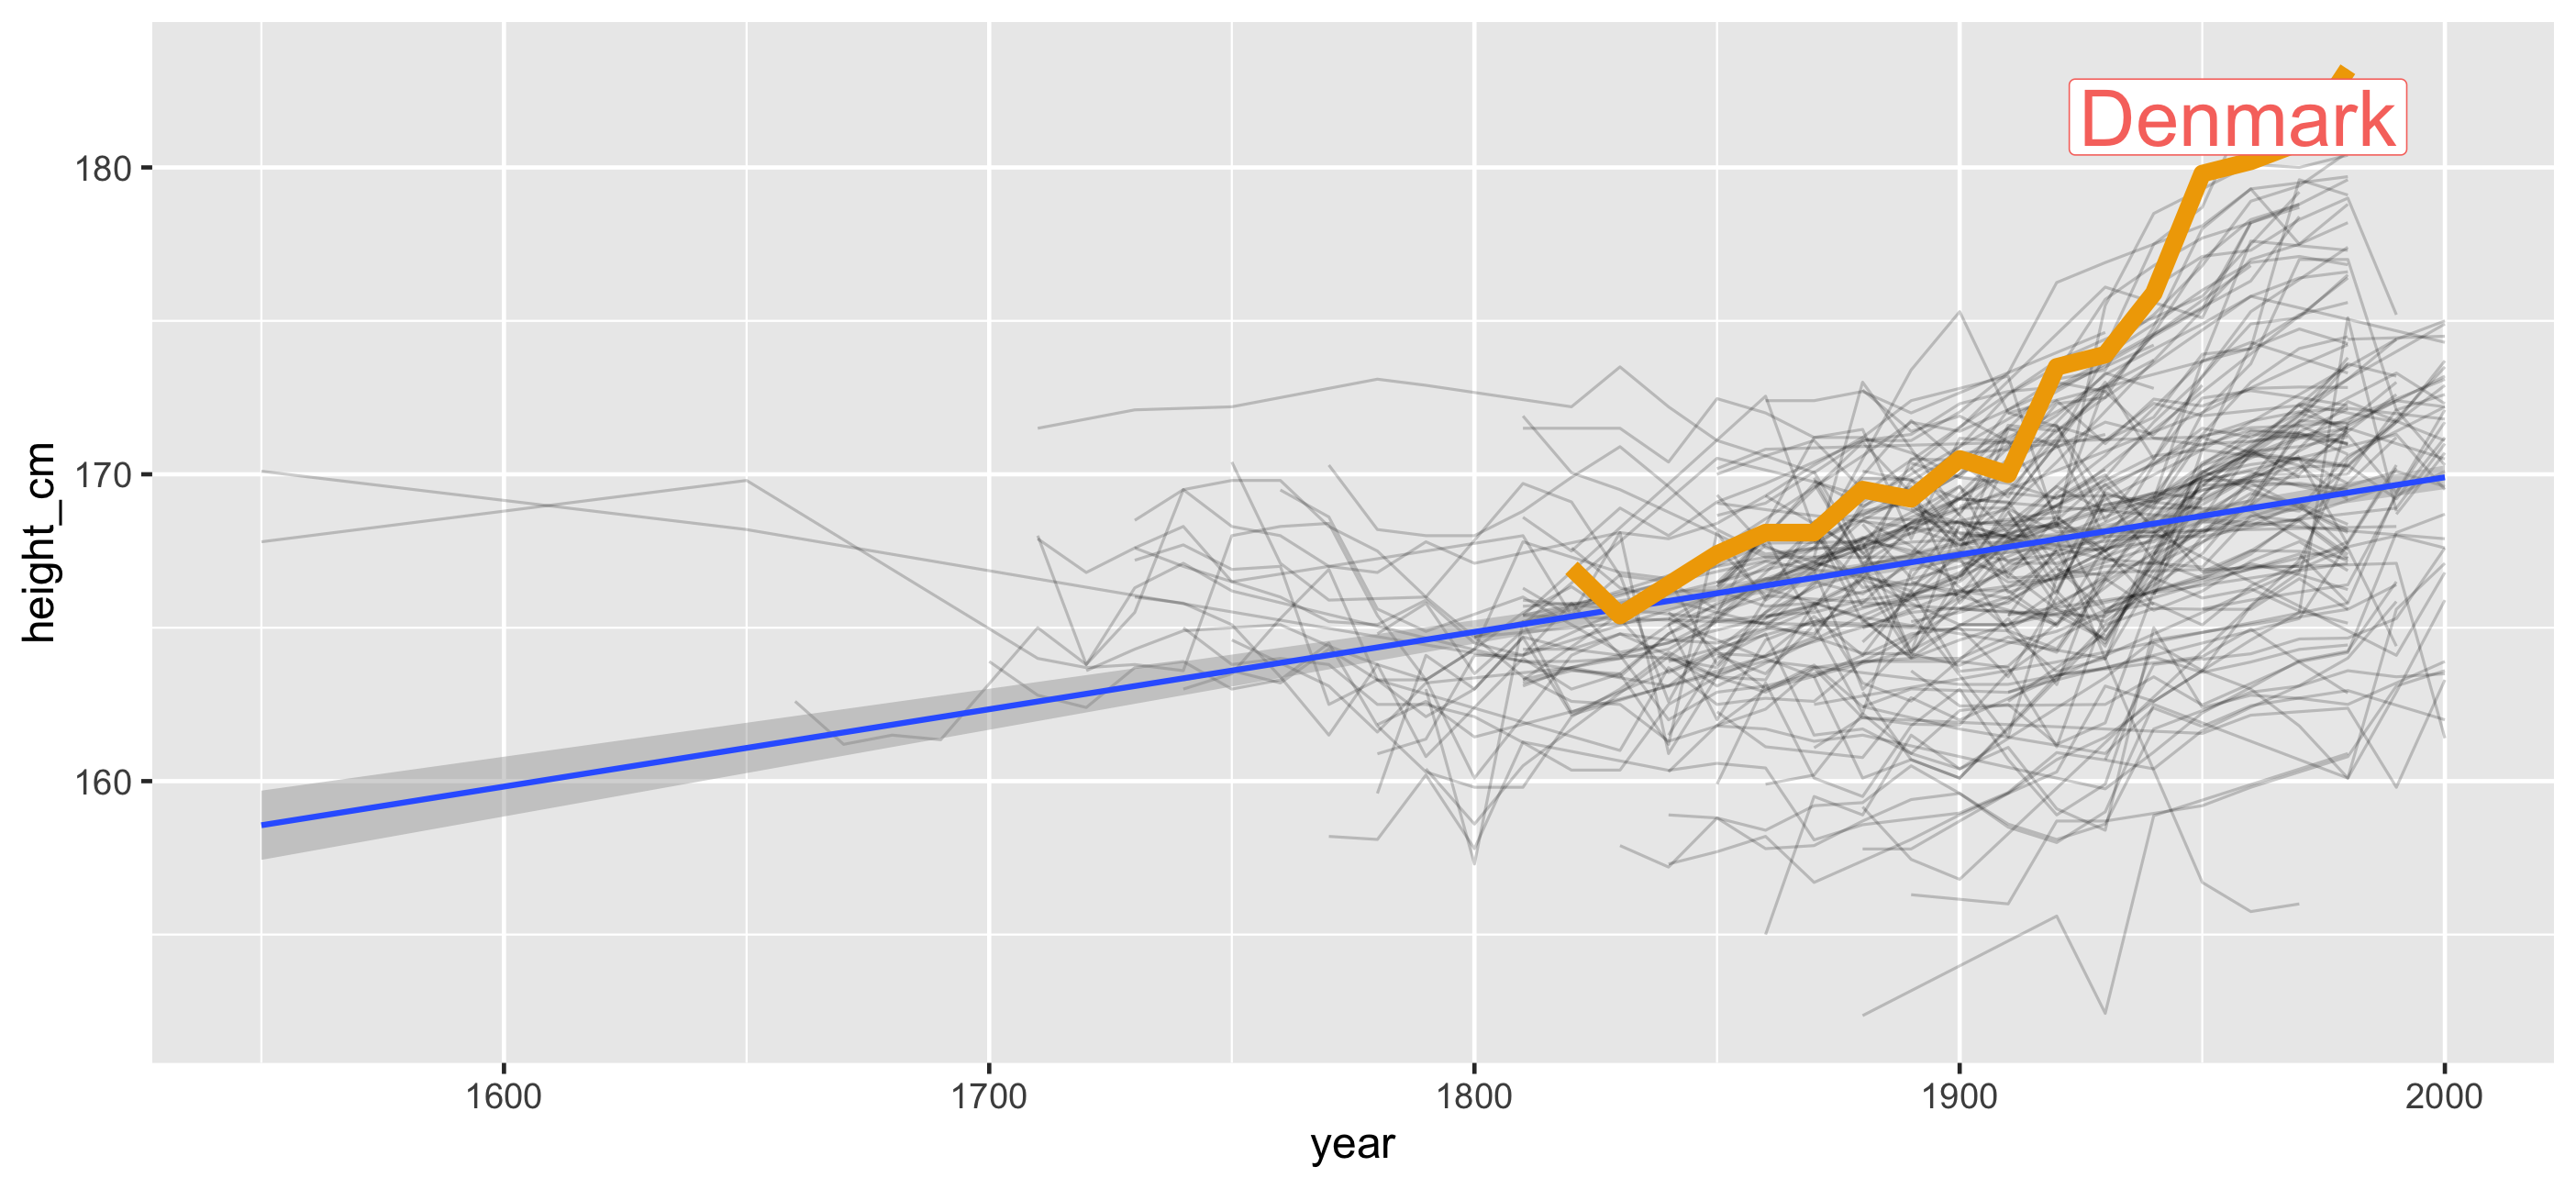
Define interesting?
Identify features: summarise down to one observation
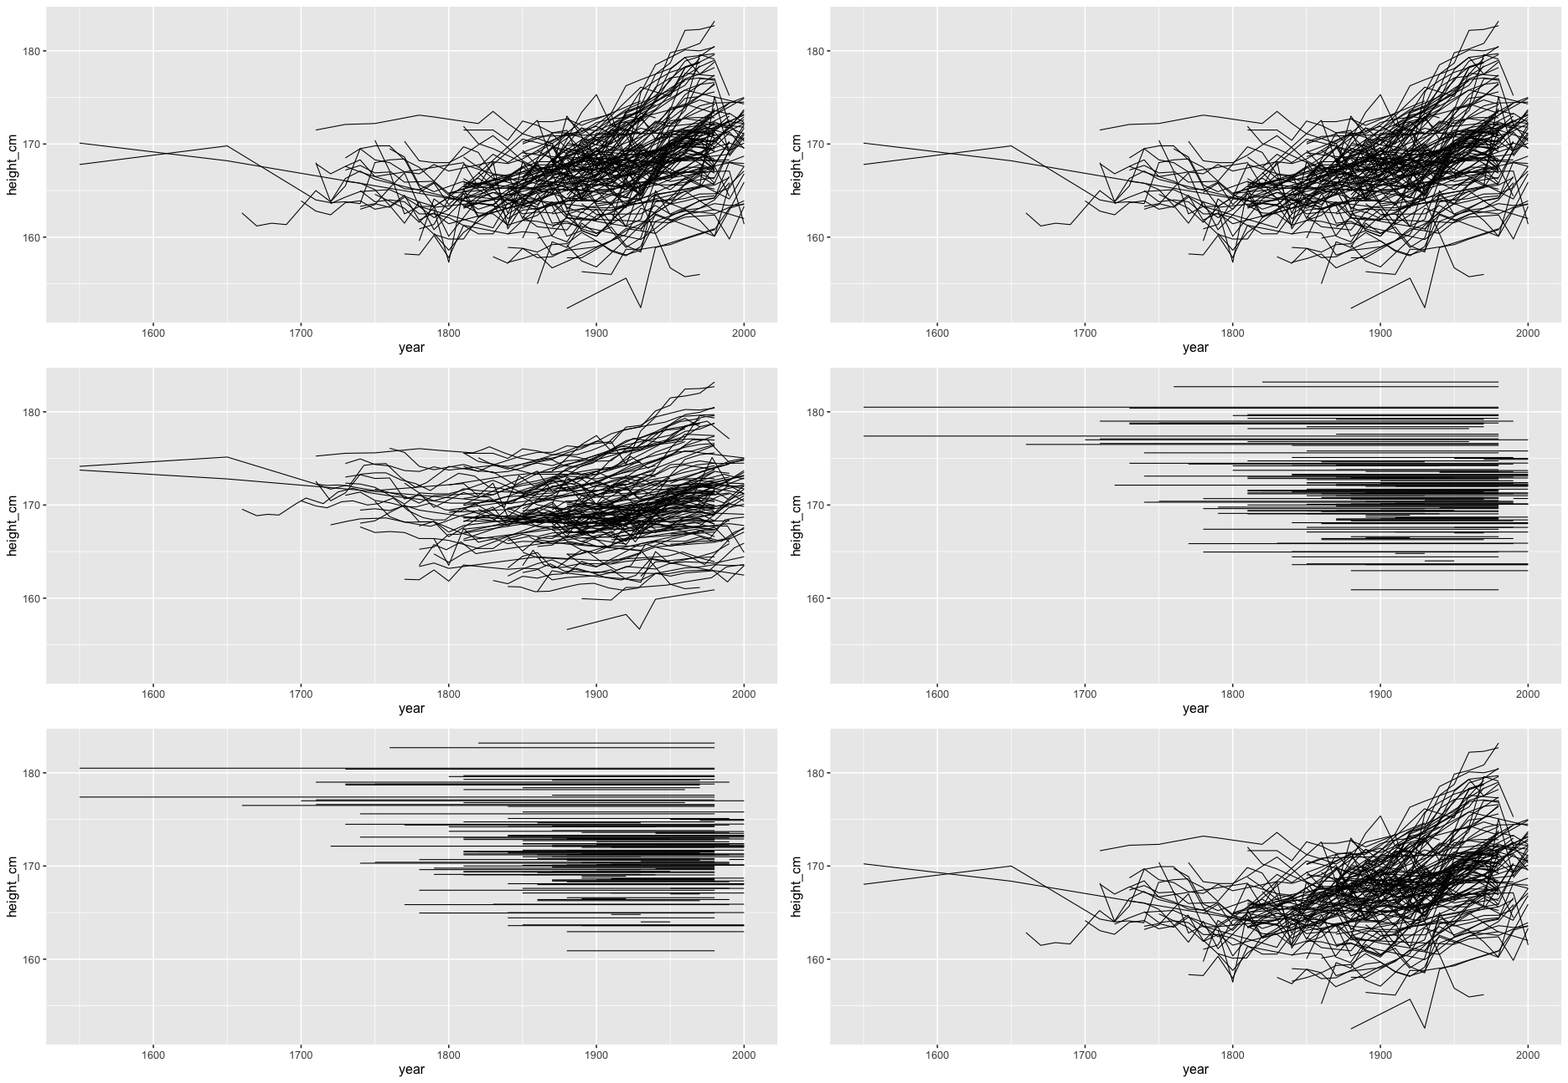
Identify features: summarise down to one observation
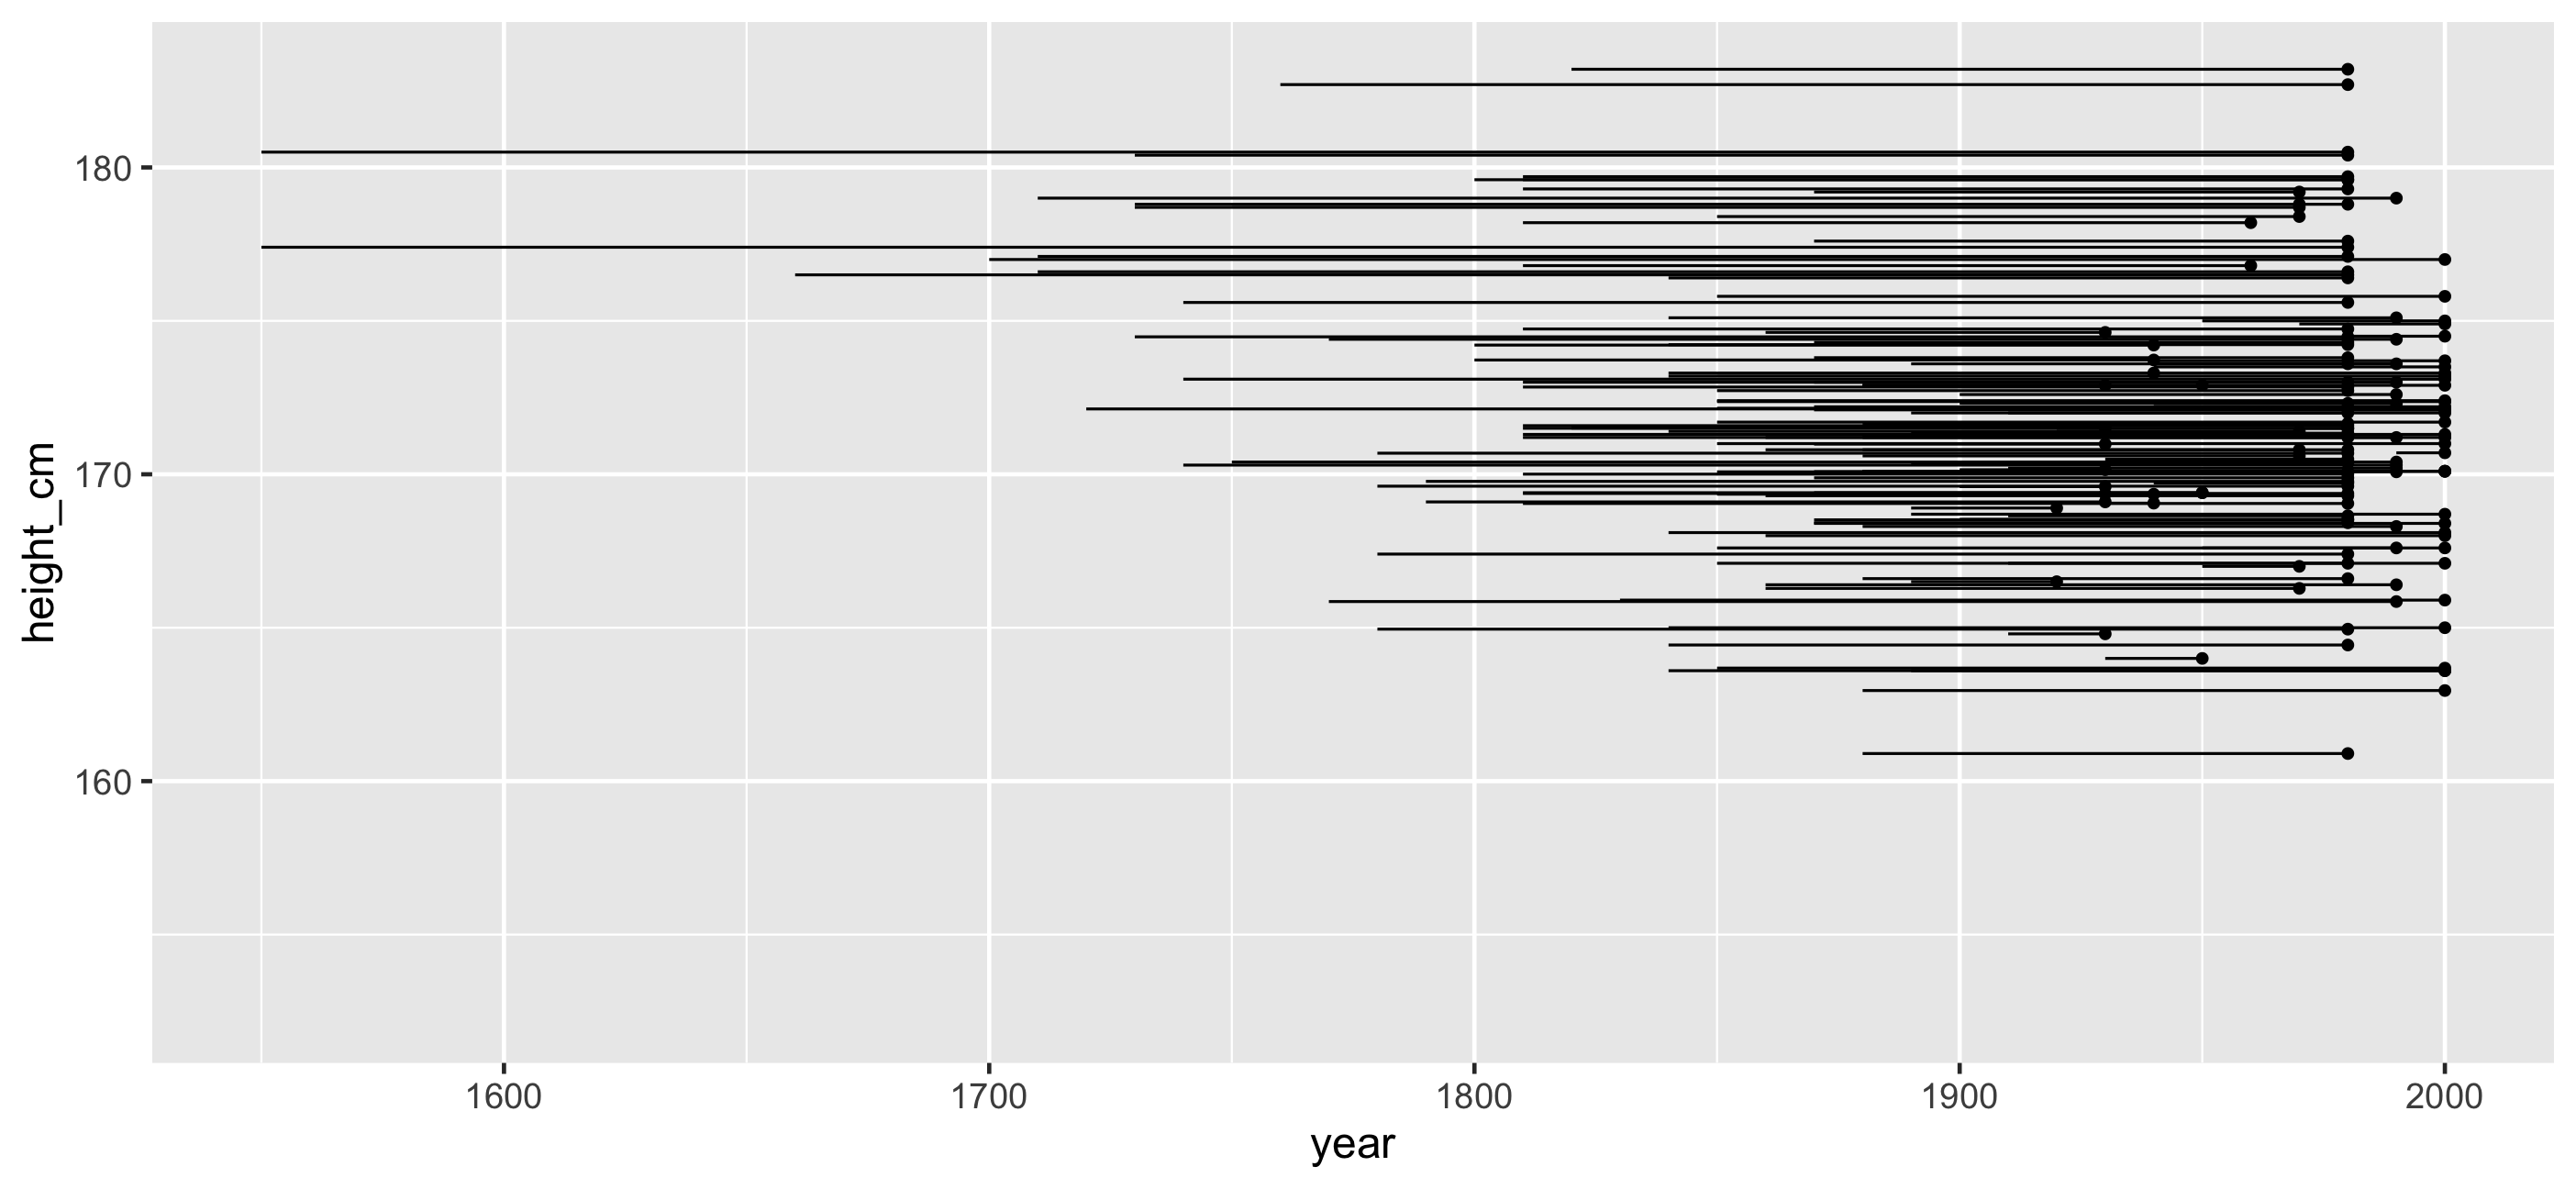
Identify features: summarise down to one observation
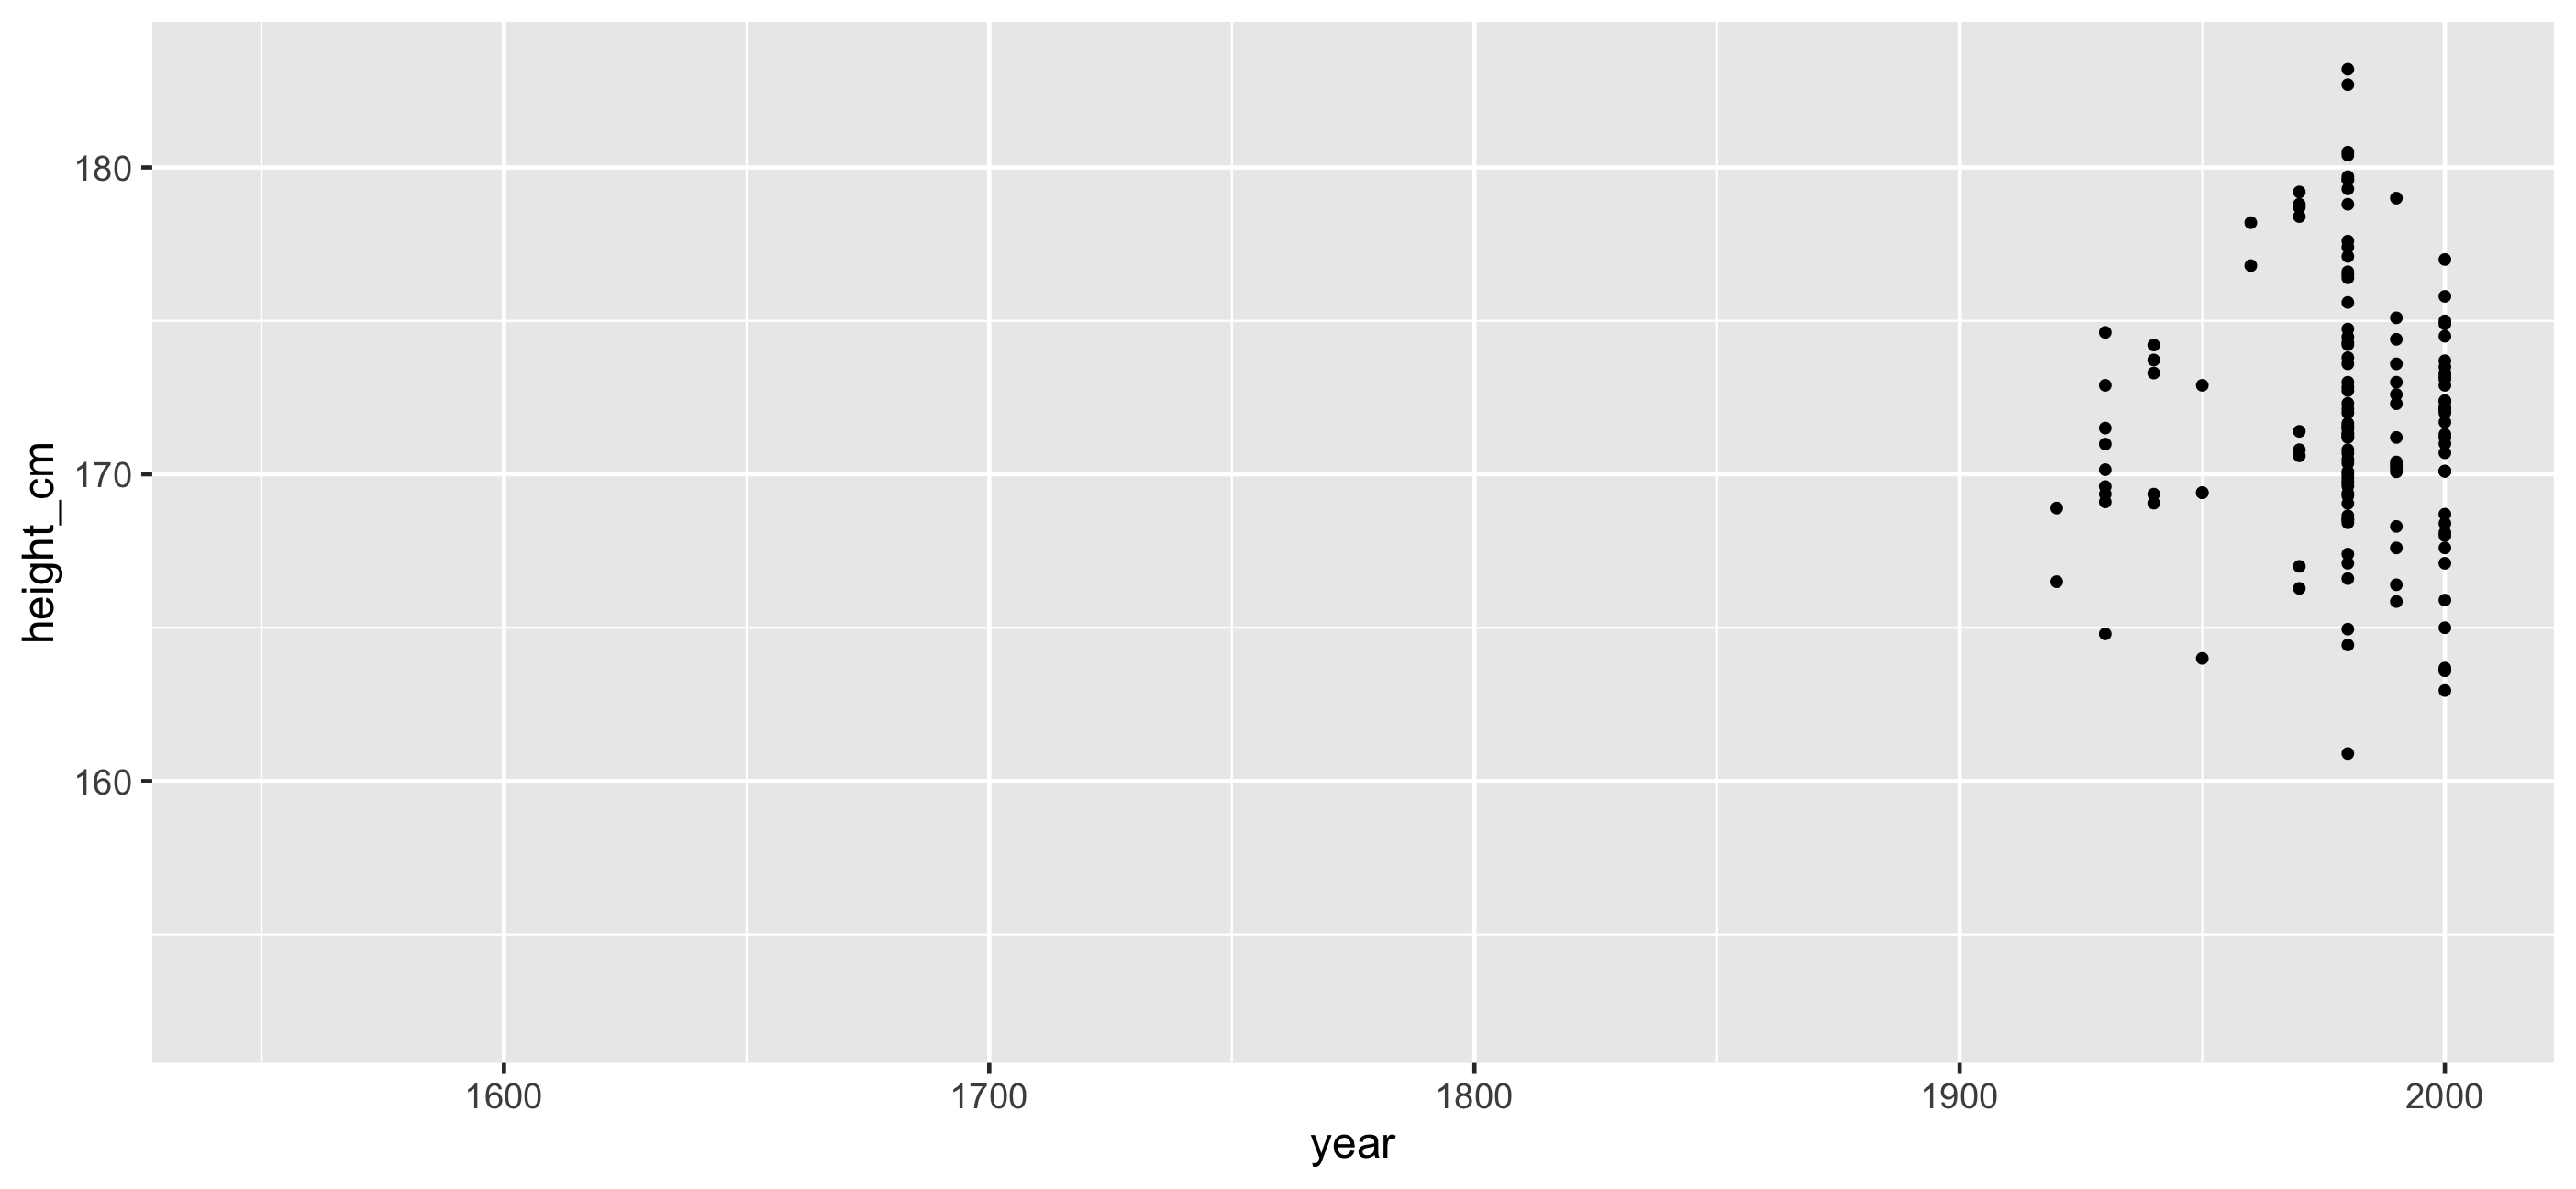
Identify important features and decide how to filter
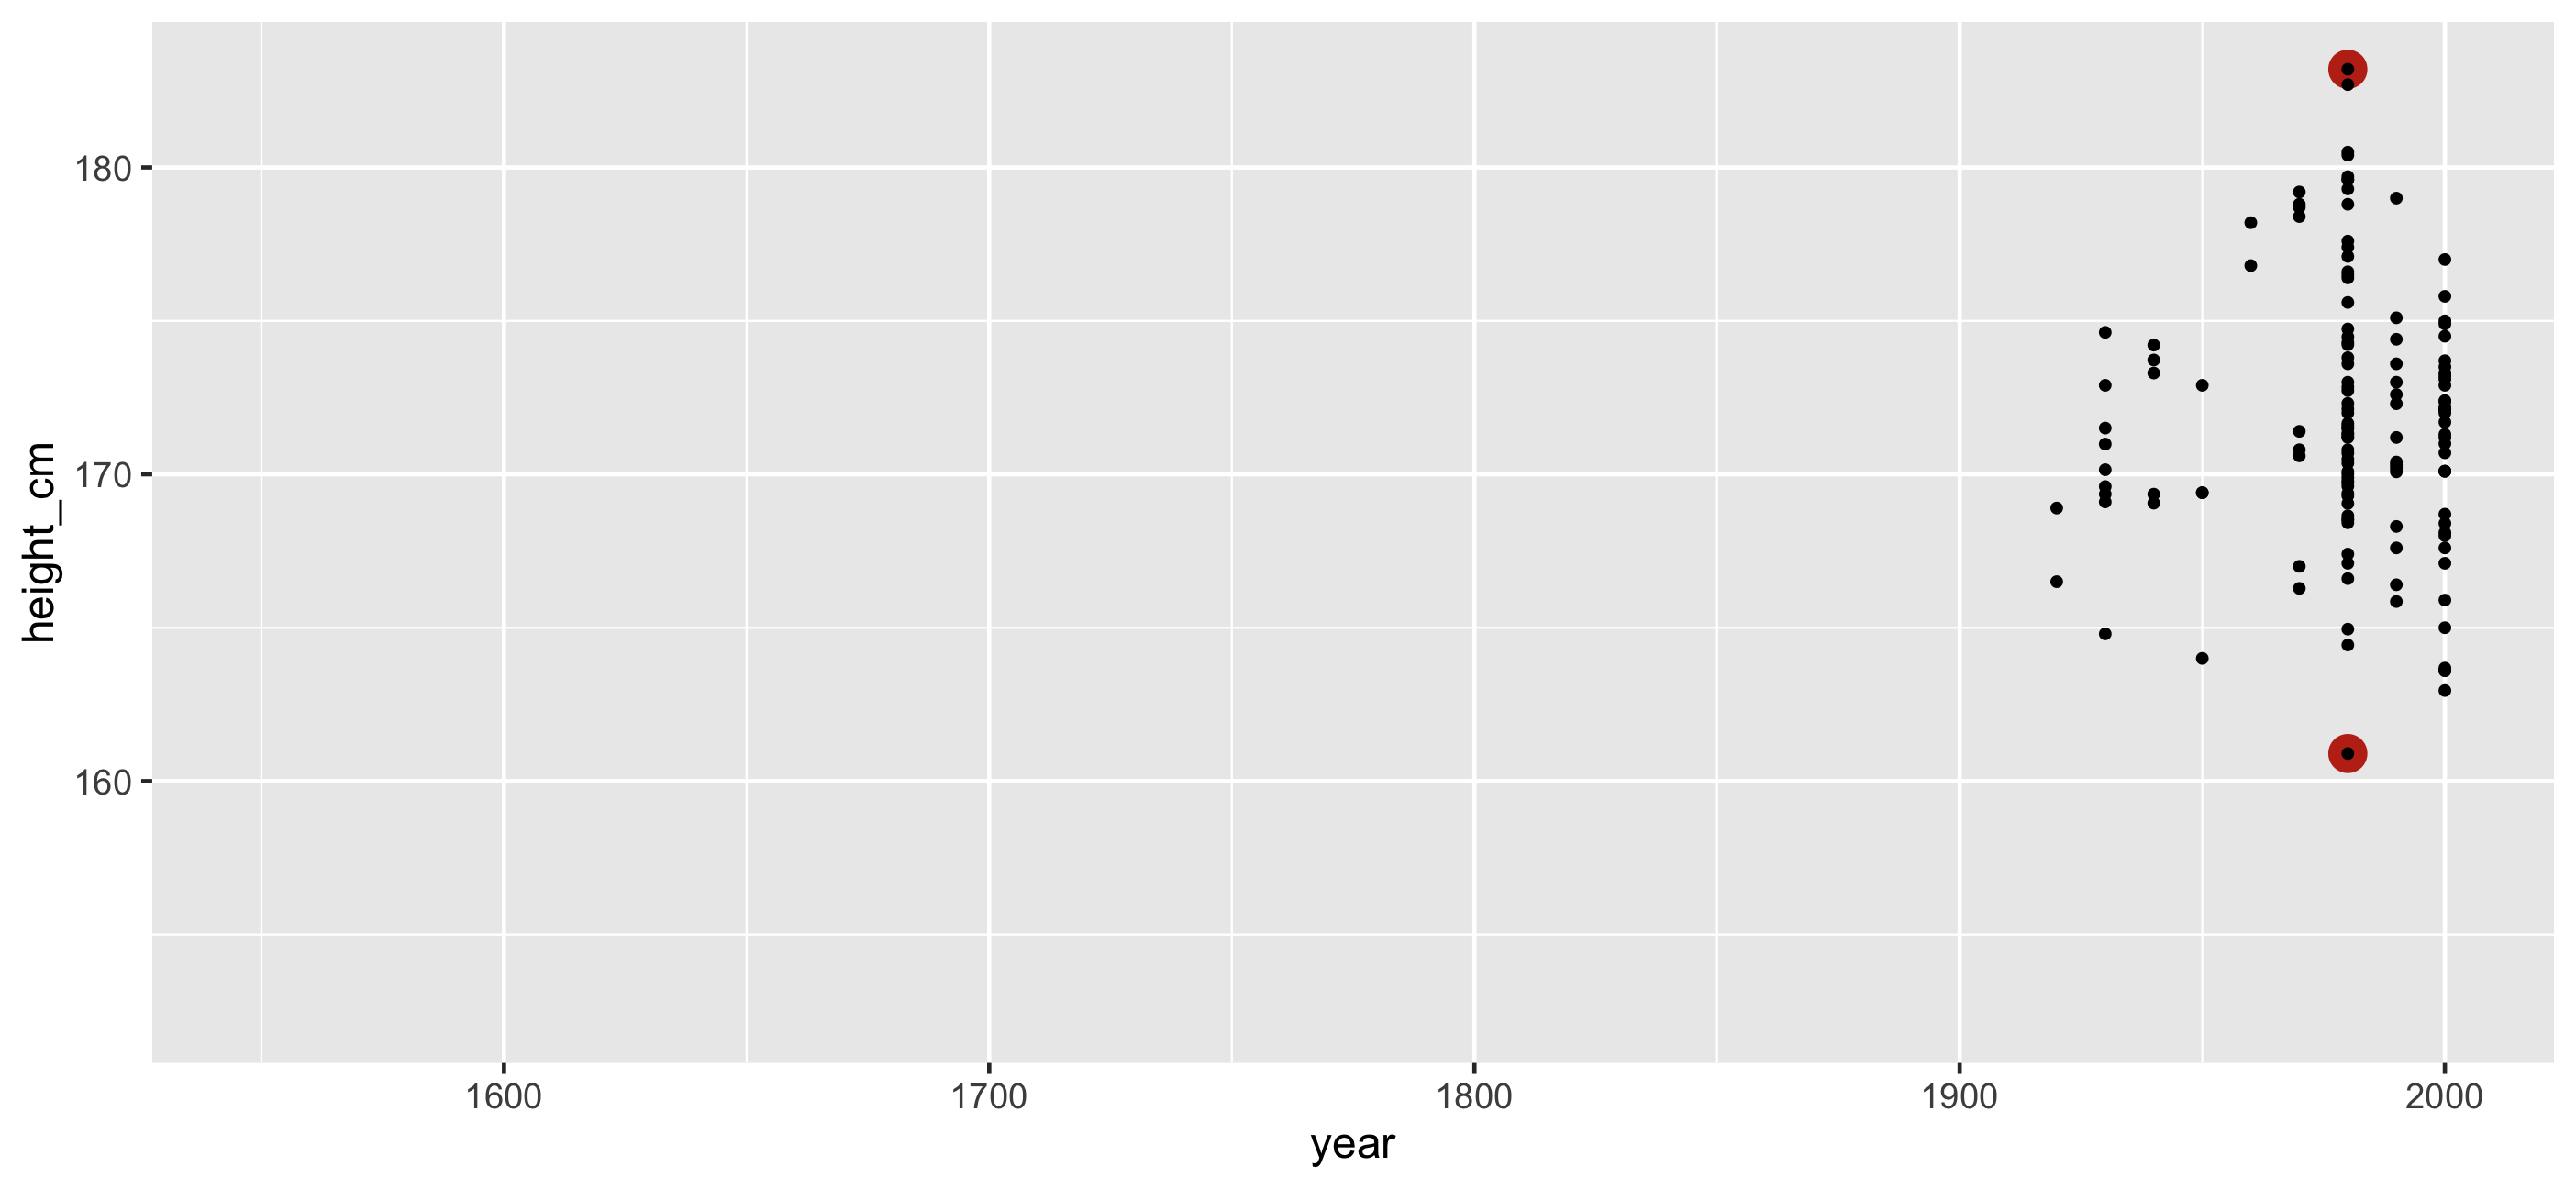
Identify important features and decide how to filter
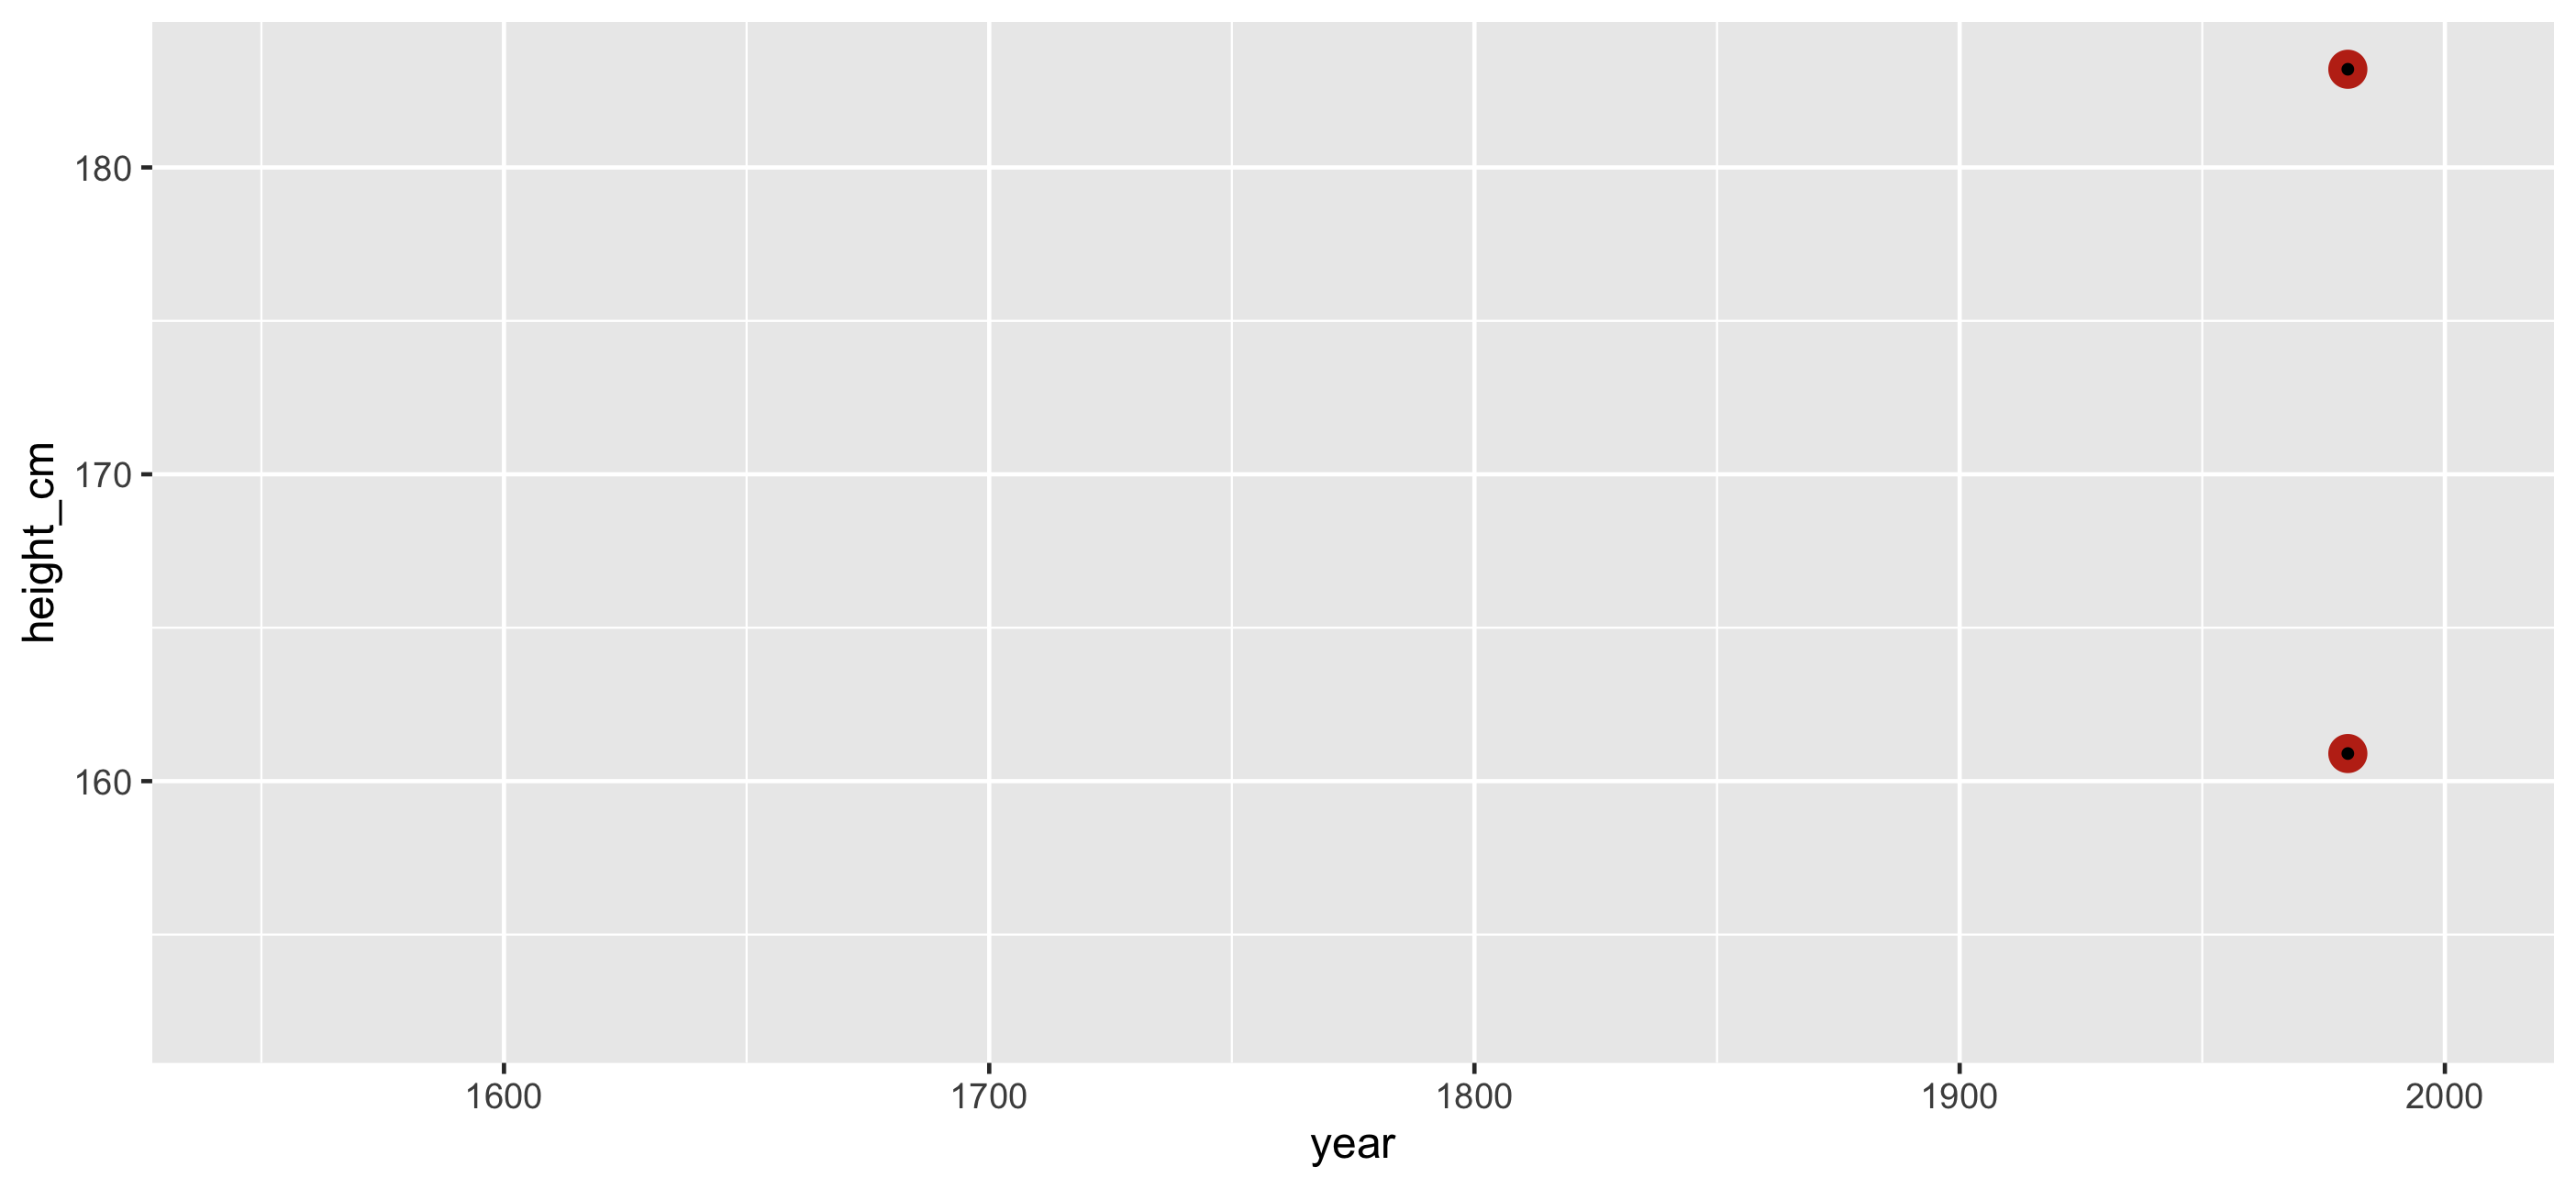
Join this feature back to the data
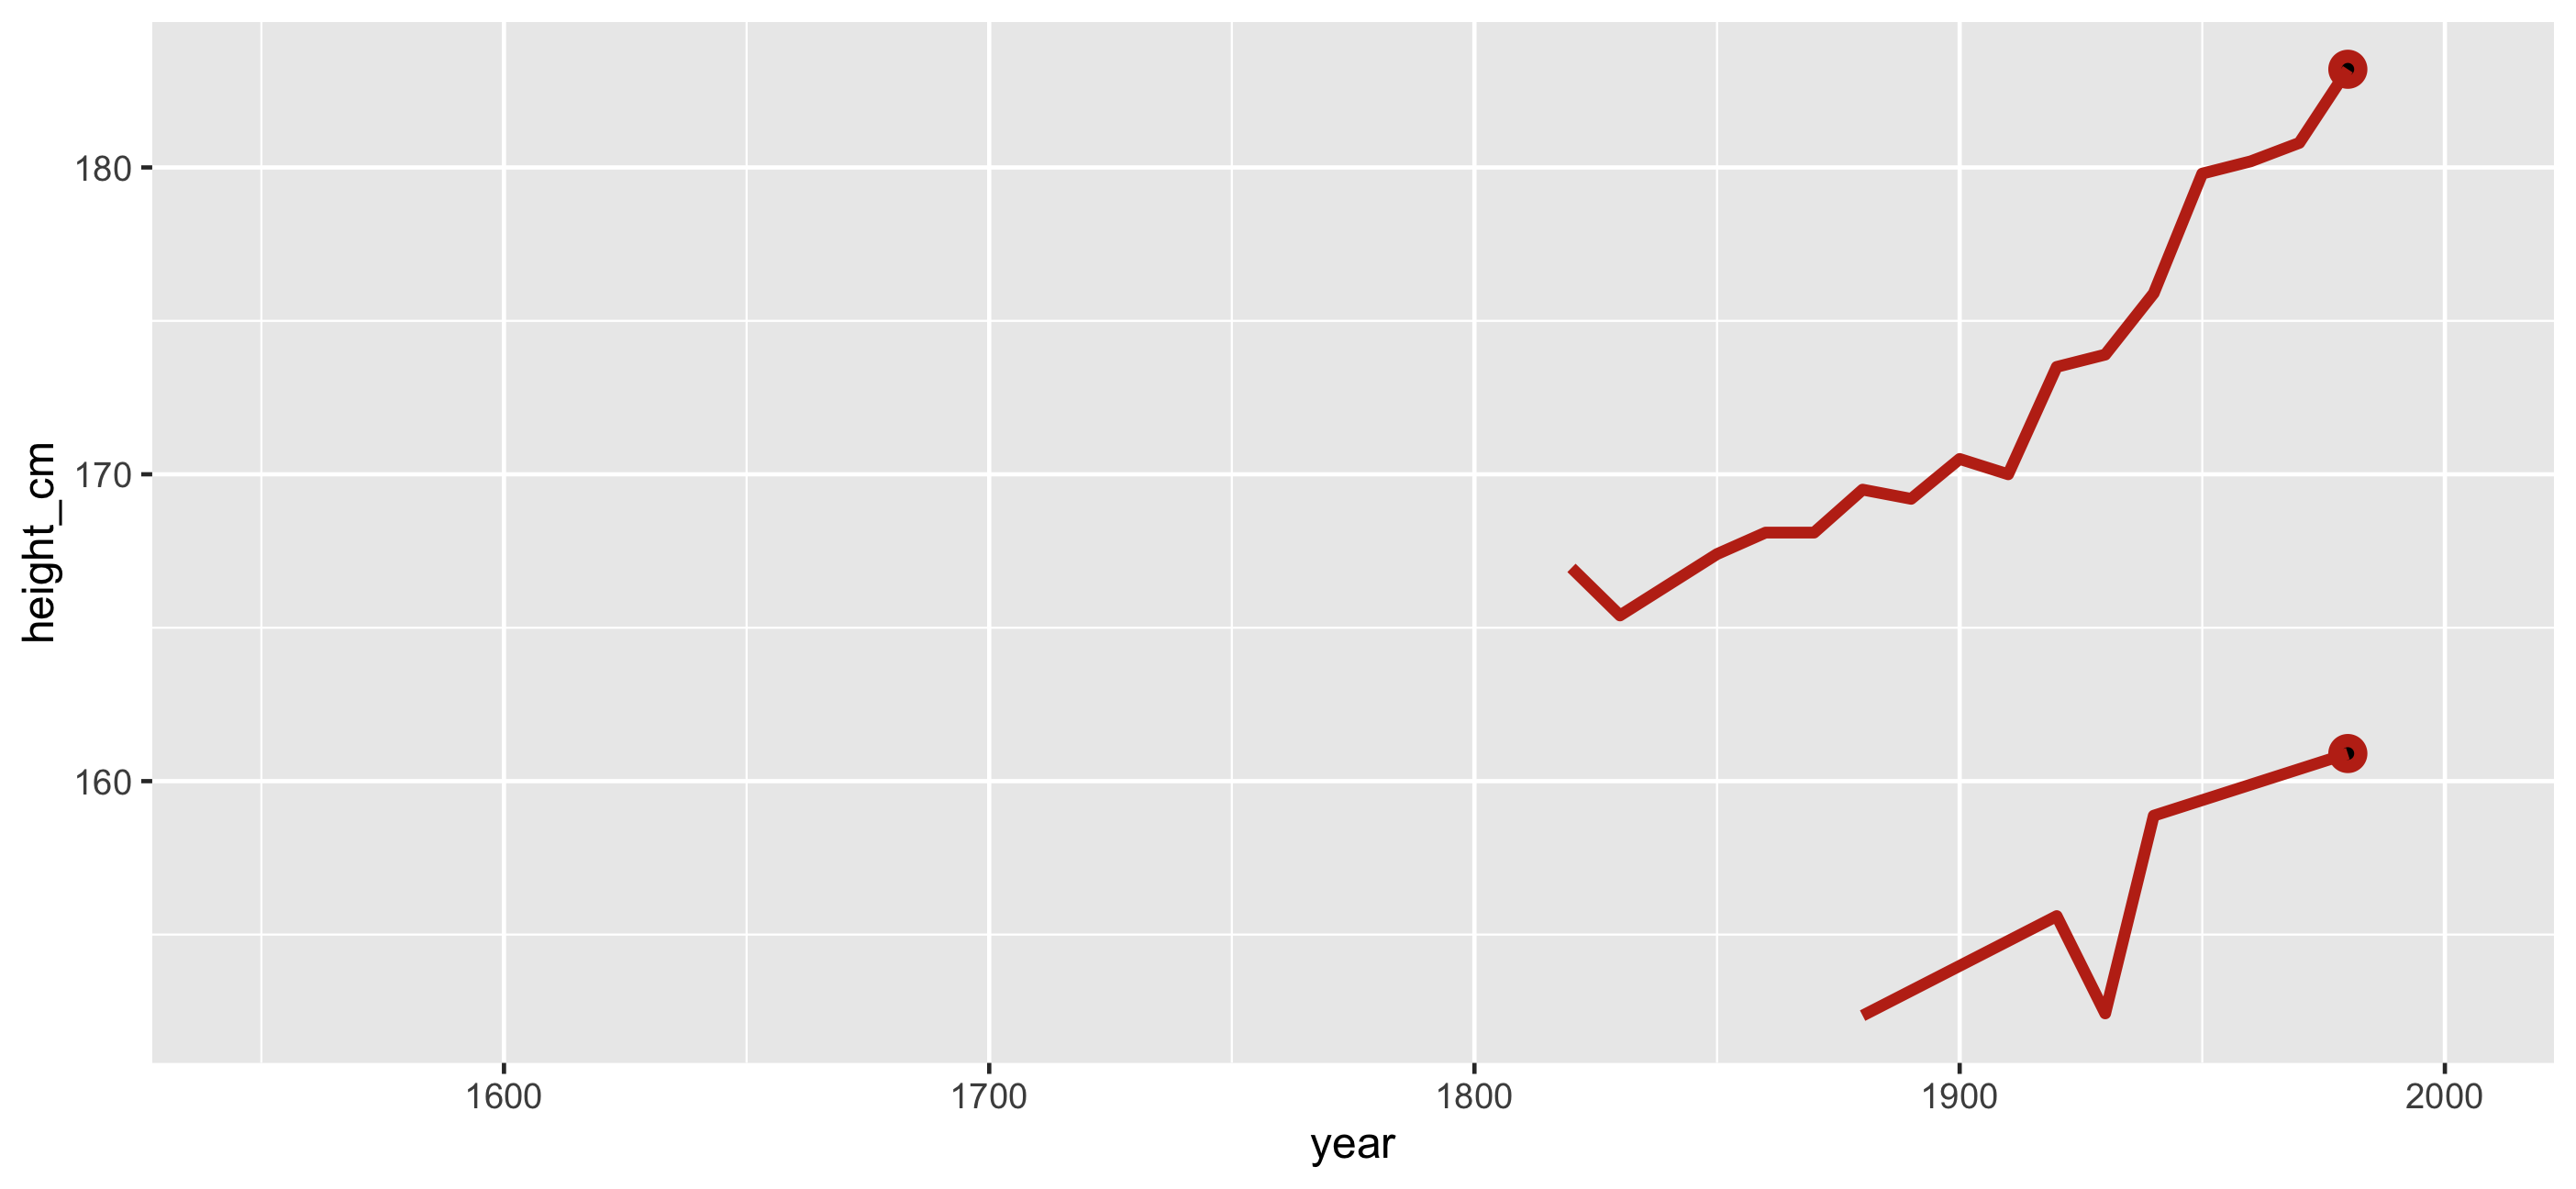
Join this feature back to the data
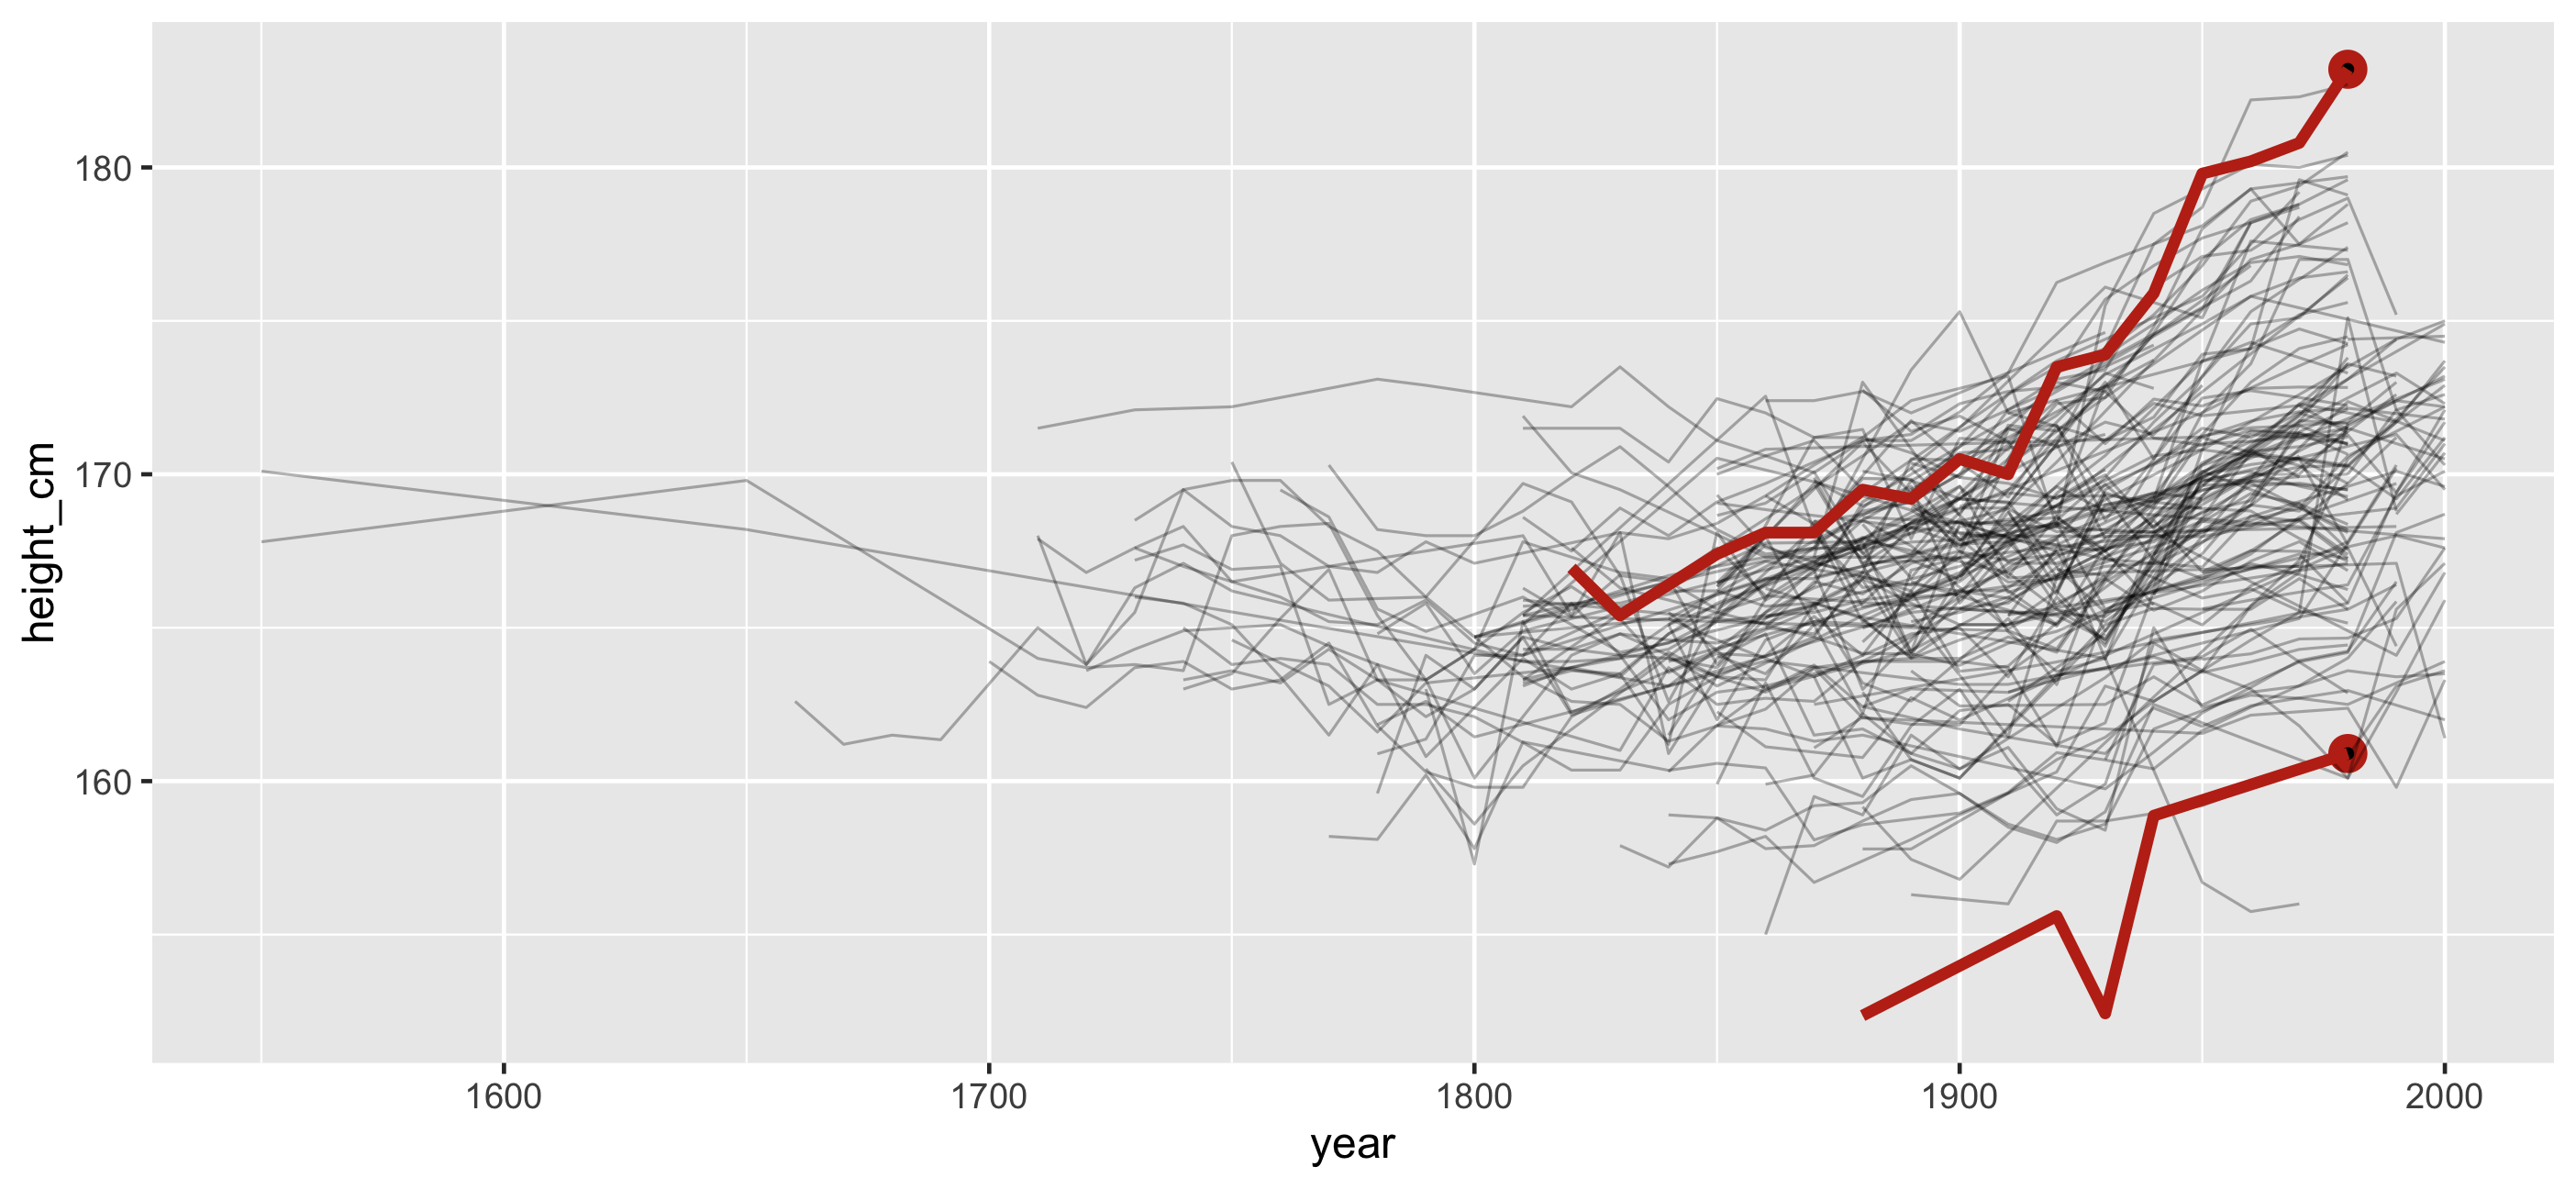
🎉 Countries with smallest and largest max height
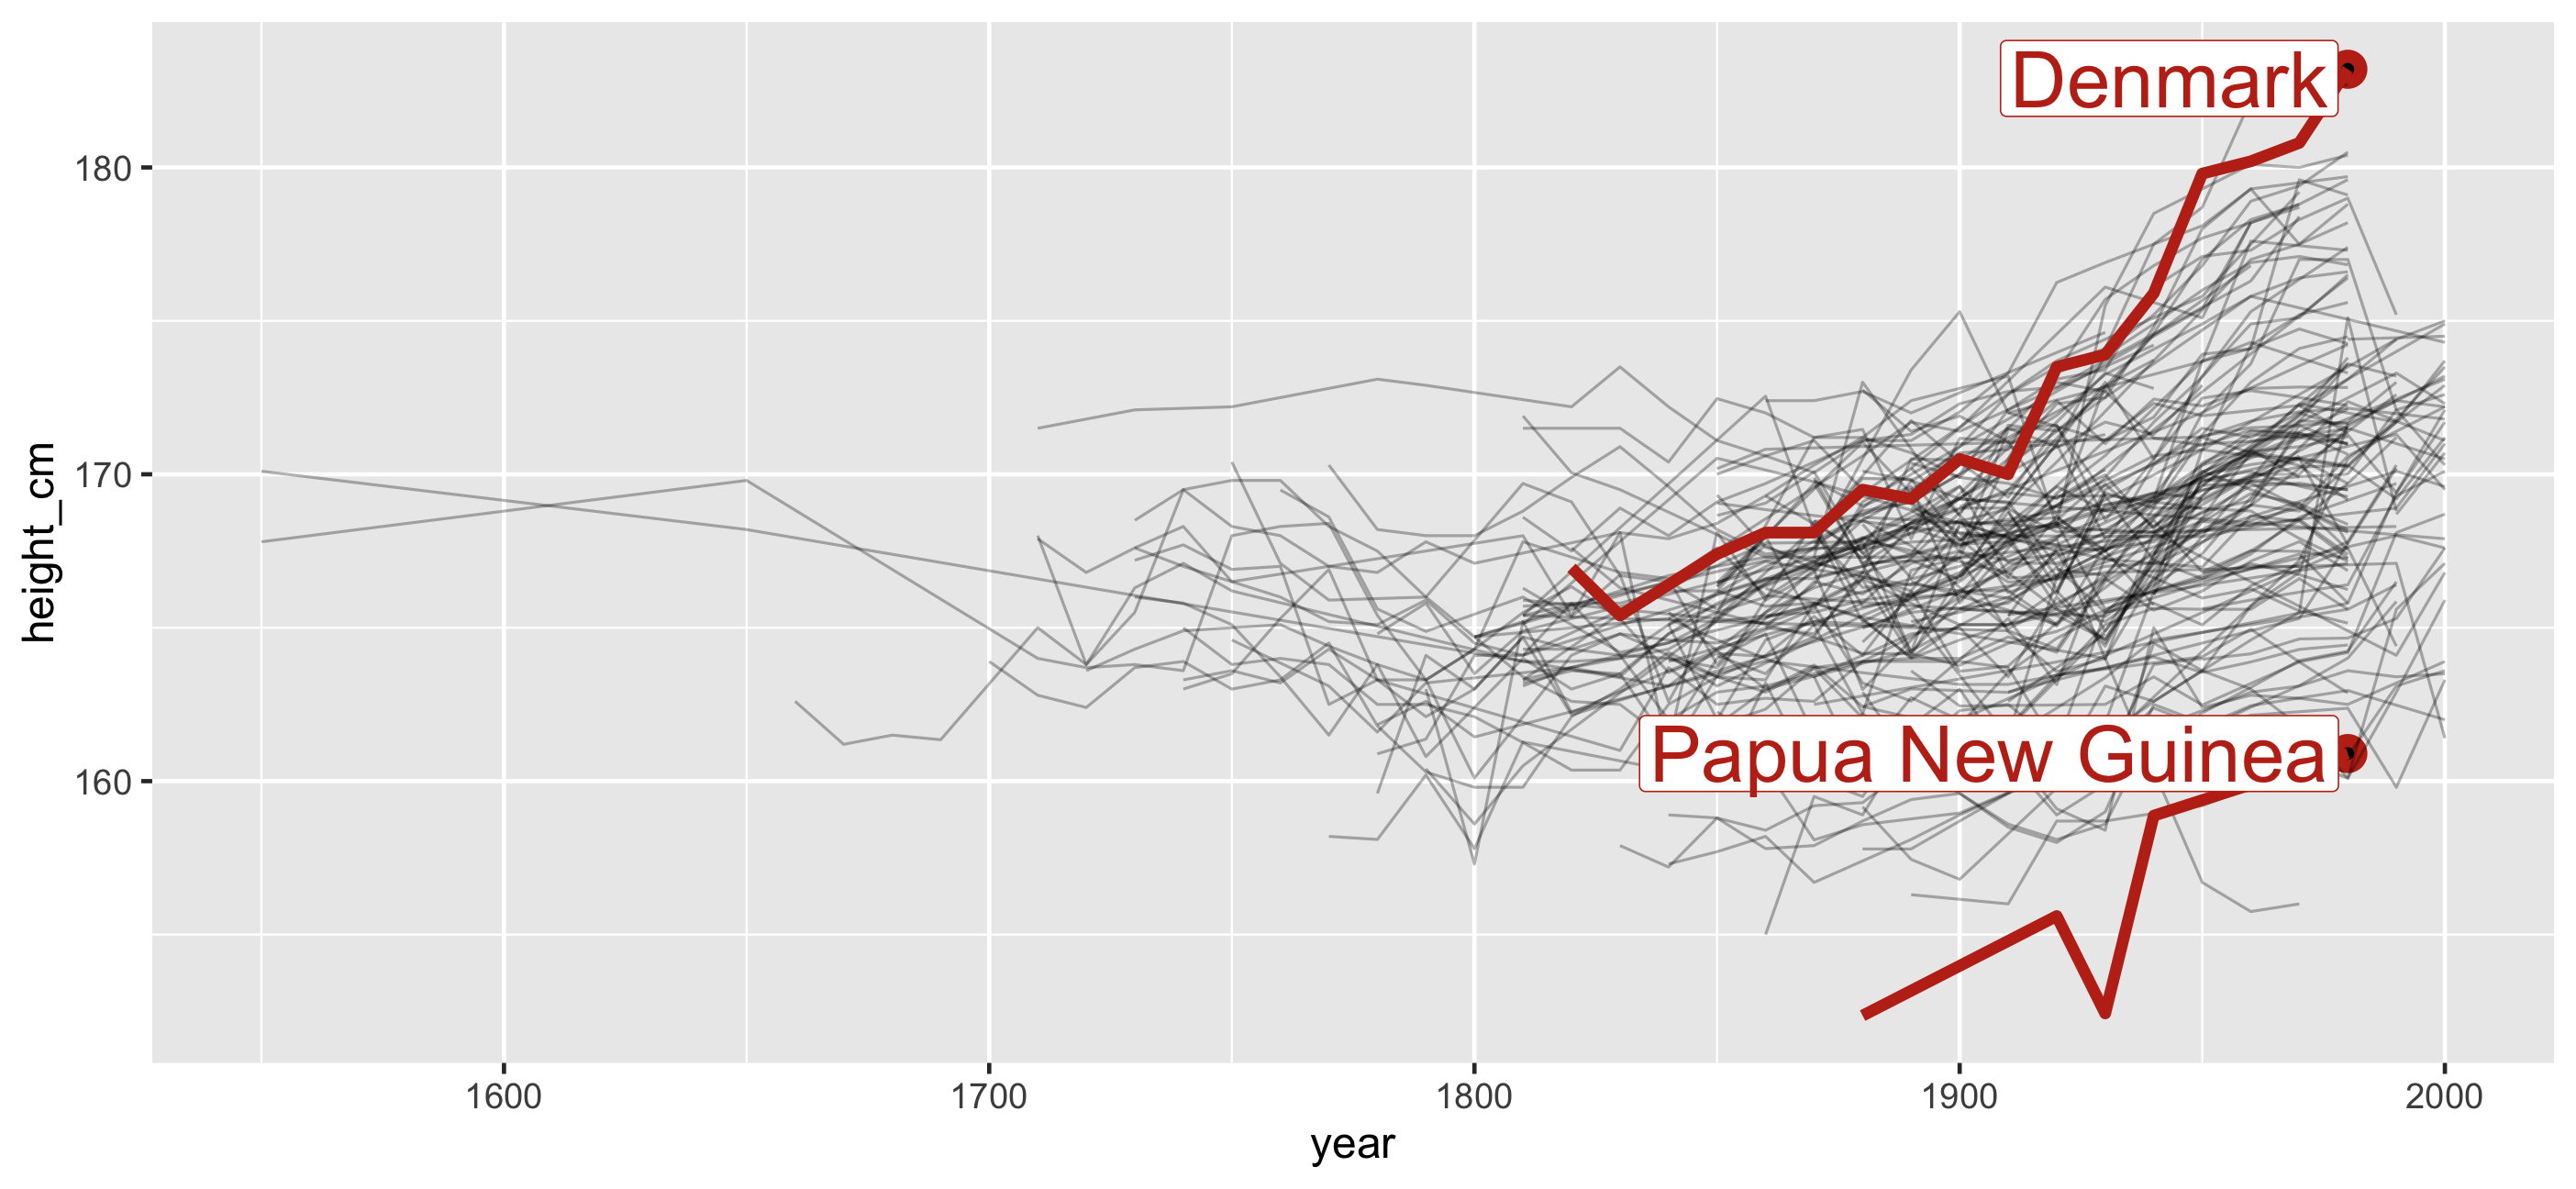
Let's see that one more time, but with the data
Identify features: summarise down to one observation
## # A tsibble: 1,490 x 3 [!]## # Key: country [144]## country year height_cm## <chr> <dbl> <dbl>## 1 Afghanistan 1870 168.## 2 Afghanistan 1880 166.## 3 Afghanistan 1930 167.## 4 Afghanistan 1990 167.## 5 Afghanistan 2000 161.## 6 Albania 1880 170.## 7 Albania 1890 170.## 8 Albania 1900 169.## 9 Albania 2000 168.## 10 Algeria 1910 169.## # … with 1,480 more rowsIdentify features: summarise down to one observation
## # A tibble: 144 x 6## country min q25 med q75 max## <chr> <dbl> <dbl> <dbl> <dbl> <dbl>## 1 Afghanistan 161. 164. 167. 168. 168.## 2 Albania 168. 168. 170. 170. 170.## 3 Algeria 166. 168. 169 170. 171.## 4 Angola 159. 160. 167. 168. 169.## 5 Argentina 167. 168. 168. 170. 174.## 6 Armenia 164. 166. 169. 172. 172.## 7 Australia 170 171. 172. 173. 178.## 8 Austria 162. 164. 167. 169. 179.## 9 Azerbaijan 170. 171. 172. 172. 172.## 10 Bahrain 161. 161. 164. 164. 164 ## # … with 134 more rowsIdentify important features and decide how to filter
heights_five %>% filter(max == max(max) | max == min(max))## # A tibble: 2 x 6## country min q25 med q75 max## <chr> <dbl> <dbl> <dbl> <dbl> <dbl>## 1 Denmark 165. 168. 170. 178. 183.## 2 Papua New Guinea 152. 152. 156. 160. 161.Join summaries back to data
heights_five %>% filter(max == max(max) | max == min(max)) %>% left_join(heights, by = "country")## # A tibble: 21 x 8## country min q25 med q75 max year height_cm## <chr> <dbl> <dbl> <dbl> <dbl> <dbl> <dbl> <dbl>## 1 Denmark 165. 168. 170. 178. 183. 1820 167.## 2 Denmark 165. 168. 170. 178. 183. 1830 165.## 3 Denmark 165. 168. 170. 178. 183. 1850 167.## 4 Denmark 165. 168. 170. 178. 183. 1860 168.## 5 Denmark 165. 168. 170. 178. 183. 1870 168.## 6 Denmark 165. 168. 170. 178. 183. 1880 170.## 7 Denmark 165. 168. 170. 178. 183. 1890 169.## 8 Denmark 165. 168. 170. 178. 183. 1900 170.## 9 Denmark 165. 168. 170. 178. 183. 1910 170 ## 10 Denmark 165. 168. 170. 178. 183. 1920 174.## # … with 11 more rows
Identify features: one per key 
heights %>% features(height_cm, feat_five_num)## # A tibble: 144 x 6## country min q25 med q75 max## <chr> <dbl> <dbl> <dbl> <dbl> <dbl>## 1 Afghanistan 161. 164. 167. 168. 168.## 2 Albania 168. 168. 170. 170. 170.## 3 Algeria 166. 168. 169 170. 171.## 4 Angola 159. 160. 167. 168. 169.## 5 Argentina 167. 168. 168. 170. 174.## 6 Armenia 164. 166. 169. 172. 172.## # … with 138 more rowsfeatures: Summaries that are aware of data structure 
features: Summaries that are aware of data structure 
heights %>% features(height_cm, #<< # variable we want to summarise feat_five_num) #<< # feature to calculatefeatures: Summaries that are aware of data structure 
heights %>% features(height_cm, #<< # variable we want to summarise feat_five_num) #<< # feature to calculate## # A tibble: 144 x 6## country min q25 med q75 max## <chr> <dbl> <dbl> <dbl> <dbl> <dbl>## 1 Afghanistan 161. 164. 167. 168. 168.## 2 Albania 168. 168. 170. 170. 170.## 3 Algeria 166. 168. 169 170. 171.## 4 Angola 159. 160. 167. 168. 169.## 5 Argentina 167. 168. 168. 170. 174.## 6 Armenia 164. 166. 169. 172. 172.## # … with 138 more rowsOther available features() in brolgar
What is the range of the data? feat_ranges
heights %>% features(height_cm, feat_ranges)## # A tibble: 144 x 5## country min max range_diff iqr## <chr> <dbl> <dbl> <dbl> <dbl>## 1 Afghanistan 161. 168. 7 3.27## 2 Albania 168. 170. 2.20 1.53## 3 Algeria 166. 171. 5.06 2.15## 4 Angola 159. 169. 10.5 7.87## 5 Argentina 167. 174. 7 2.21## 6 Armenia 164. 172. 8.82 5.30## 7 Australia 170 178. 8.4 2.58## 8 Austria 162. 179. 17.2 5.35## 9 Azerbaijan 170. 172. 1.97 1.12## 10 Bahrain 161. 164 3.3 2.75## # … with 134 more rowsDoes it only increase or decrease? feat_monotonic
heights %>% features(height_cm, feat_monotonic)## # A tibble: 144 x 5## country increase decrease unvary monotonic## <chr> <lgl> <lgl> <lgl> <lgl> ## 1 Afghanistan FALSE FALSE FALSE FALSE ## 2 Albania FALSE TRUE FALSE TRUE ## 3 Algeria FALSE FALSE FALSE FALSE ## 4 Angola FALSE FALSE FALSE FALSE ## 5 Argentina FALSE FALSE FALSE FALSE ## 6 Armenia FALSE FALSE FALSE FALSE ## 7 Australia FALSE FALSE FALSE FALSE ## 8 Austria FALSE FALSE FALSE FALSE ## 9 Azerbaijan FALSE FALSE FALSE FALSE ## 10 Bahrain TRUE FALSE FALSE TRUE ## # … with 134 more rowsWhat is the spread of my data? feat_spread
heights %>% features(height_cm, feat_spread)## # A tibble: 144 x 5## country var sd mad iqr## <chr> <dbl> <dbl> <dbl> <dbl>## 1 Afghanistan 7.20 2.68 1.65 3.27## 2 Albania 0.950 0.975 0.667 1.53## 3 Algeria 3.30 1.82 0.741 2.15## 4 Angola 16.9 4.12 3.11 7.87## 5 Argentina 2.89 1.70 1.36 2.21## 6 Armenia 10.6 3.26 3.60 5.30## 7 Australia 7.63 2.76 1.66 2.58## 8 Austria 26.6 5.16 3.93 5.35## 9 Azerbaijan 0.516 0.718 0.621 1.12## 10 Bahrain 3.42 1.85 0.297 2.75## # … with 134 more rowsfeatures: MANY more features in feasts 
Such as:
feat_acf: autocorrelation-based featuresfeat_stl: STL (Seasonal, Trend, and Remainder by LOESS) decomposition
features: what is feat_five_num? 
features: what is feat_five_num? 
feat_five_num## function(x, ...) {## list(## min = b_min(x, ...),## q25 = b_q25(x, ...),## med = b_median(x, ...),## q75 = b_q75(x, ...),## max = b_max(x, ...)## )## }## <bytecode: 0x7fa11b5b9d28>## <environment: namespace:brolgar>features: what is feat_five_num? 
Problem #1: How do I look at some of the data?
Problem #1: How do I look at some of the data?
Problem #2: How do I find interesting observations?
Problem #1: How do I look at some of the data?
Problem #2: How do I find interesting observations?
- Decide what features are interesting
- Summarise down to one observation
- Decide how to filter
- Join this feature back to the data
Problem #1: How do I look at some of the data?
Problem #2: How do I find interesting observations?
Problem #1: How do I look at some of the data?
Problem #2: How do I find interesting observations?
Problem #3: How do I understand my statistical model
Problem #3: How do I understand my statistical model
Let's fit a simple mixed effects model to the data
Fixed effect of year + Random intercept for country
heights_fit <- lmer(height_cm ~ year + (1|country), heights)heights_aug <- heights %>% add_predictions(heights_fit, var = "pred") %>% add_residuals(heights_fit, var = "res")Problem #3: How do I understand my statistical model
## # A tsibble: 1,490 x 5 [!]## # Key: country [144]## country year height_cm pred res## <chr> <dbl> <dbl> <dbl> <dbl>## 1 Afghanistan 1870 168. 164. 4.59 ## 2 Afghanistan 1880 166. 164. 1.52 ## 3 Afghanistan 1930 167. 166. 0.823## 4 Afghanistan 1990 167. 168. -1.04 ## 5 Afghanistan 2000 161. 169. -7.10 ## 6 Albania 1880 170. 168. 2.39 ## 7 Albania 1890 170. 168. 1.73 ## 8 Albania 1900 169. 168. 0.769## 9 Albania 2000 168. 172. -4.14 ## 10 Algeria 1910 169. 168. 1.28 ## # … with 1,480 more rowsProblem #3: How do I understand my statistical model
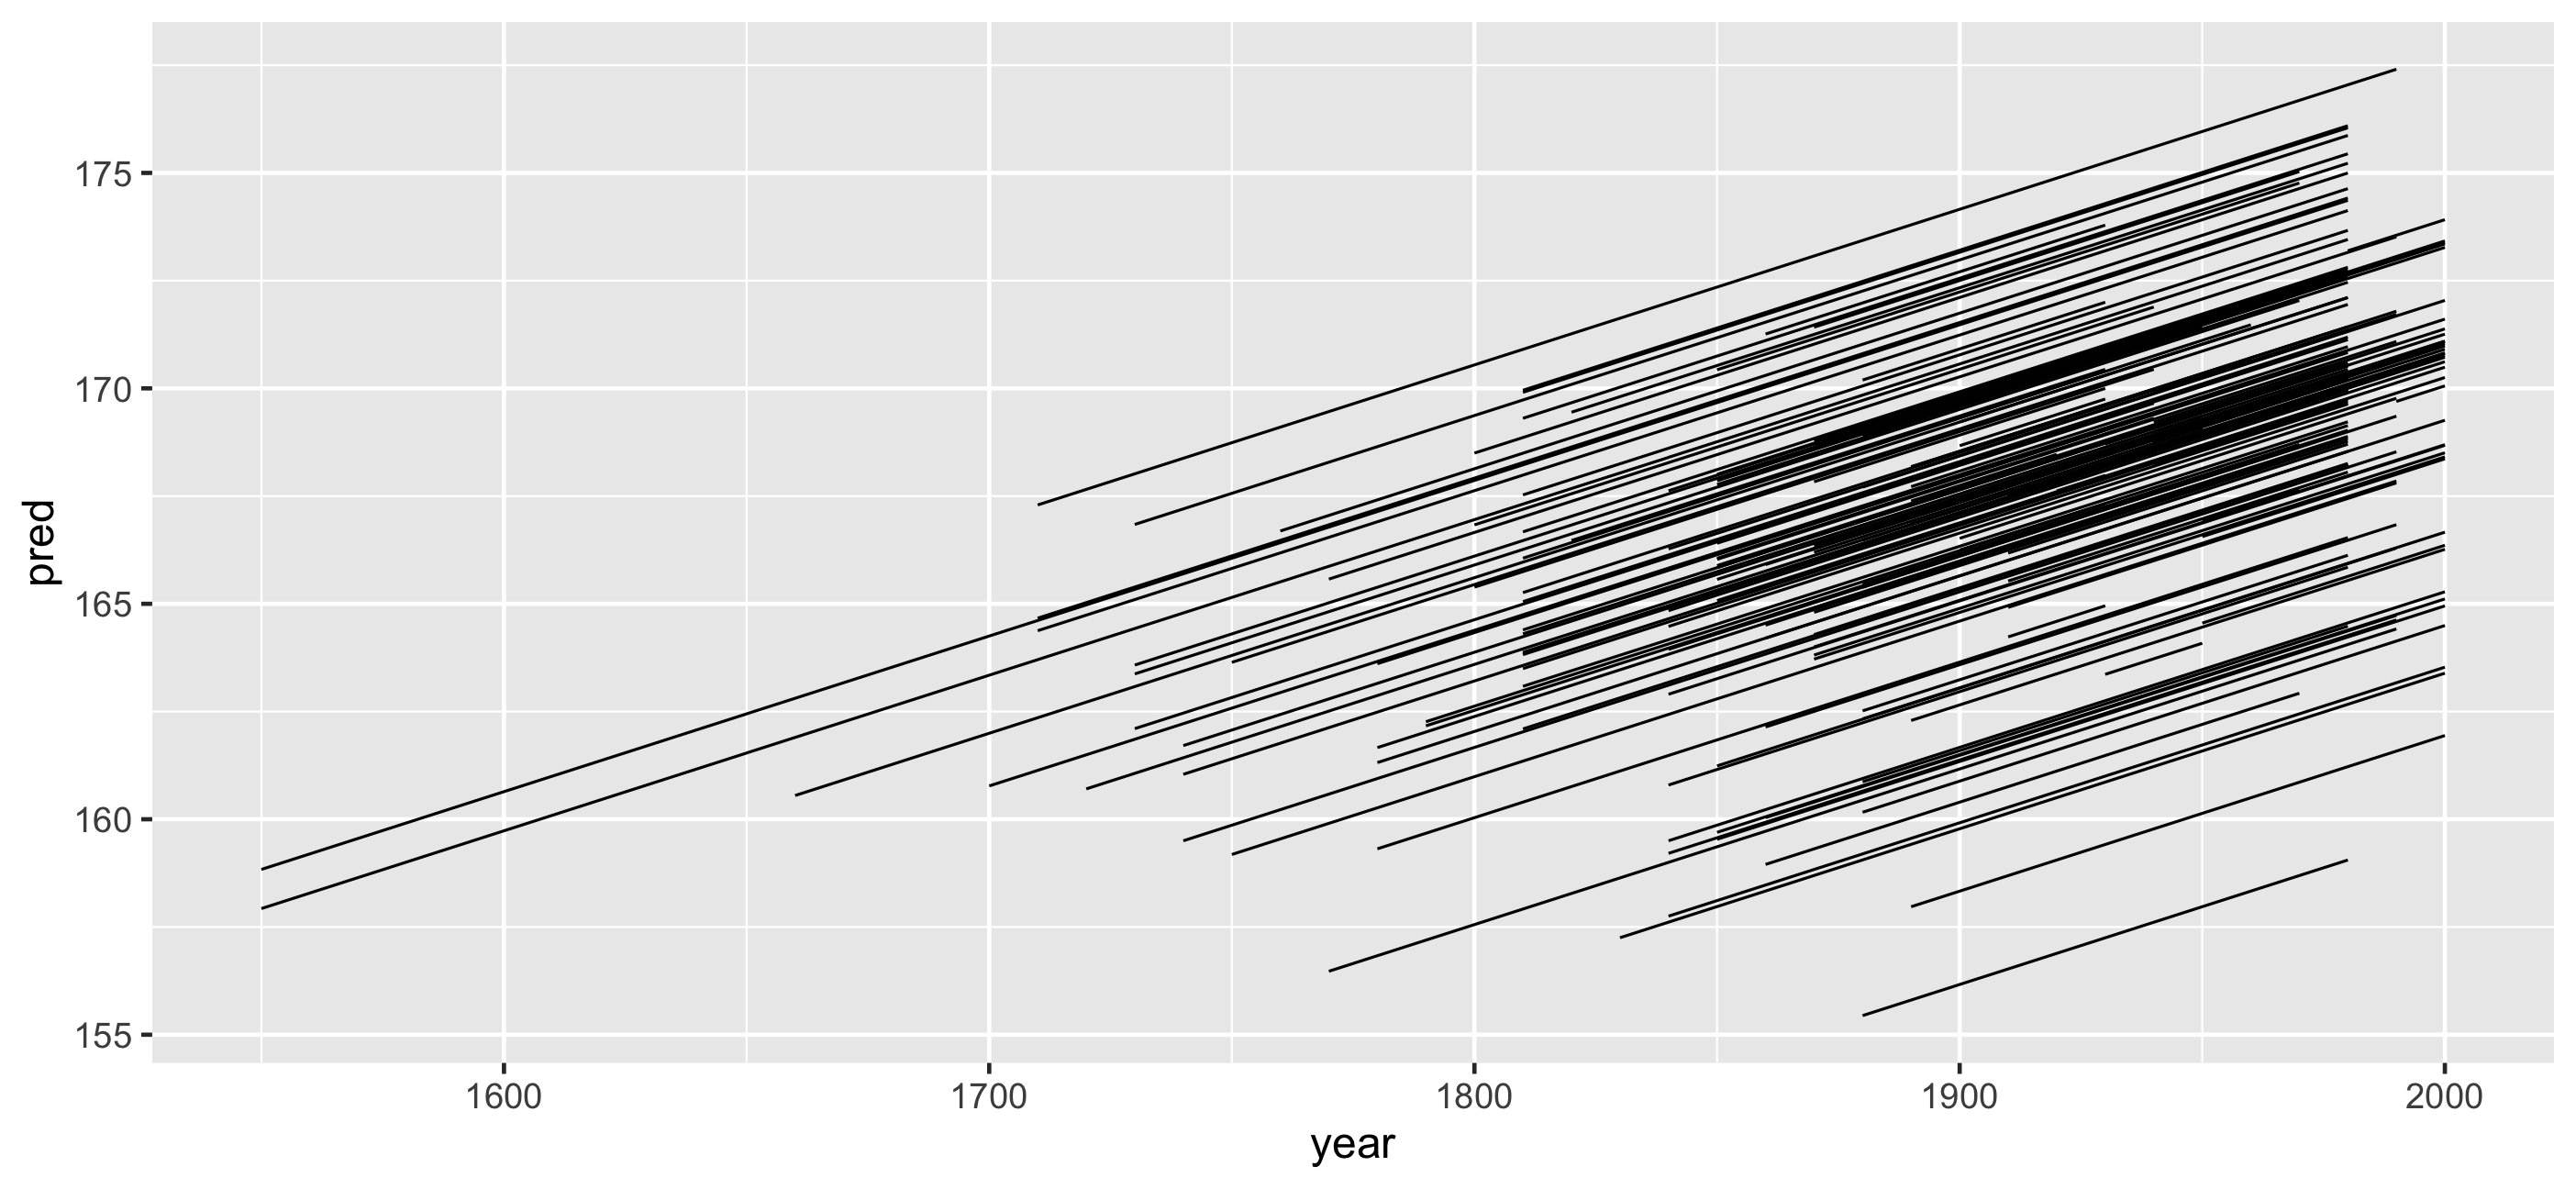
Look at subsamples?
Look at subsamples?
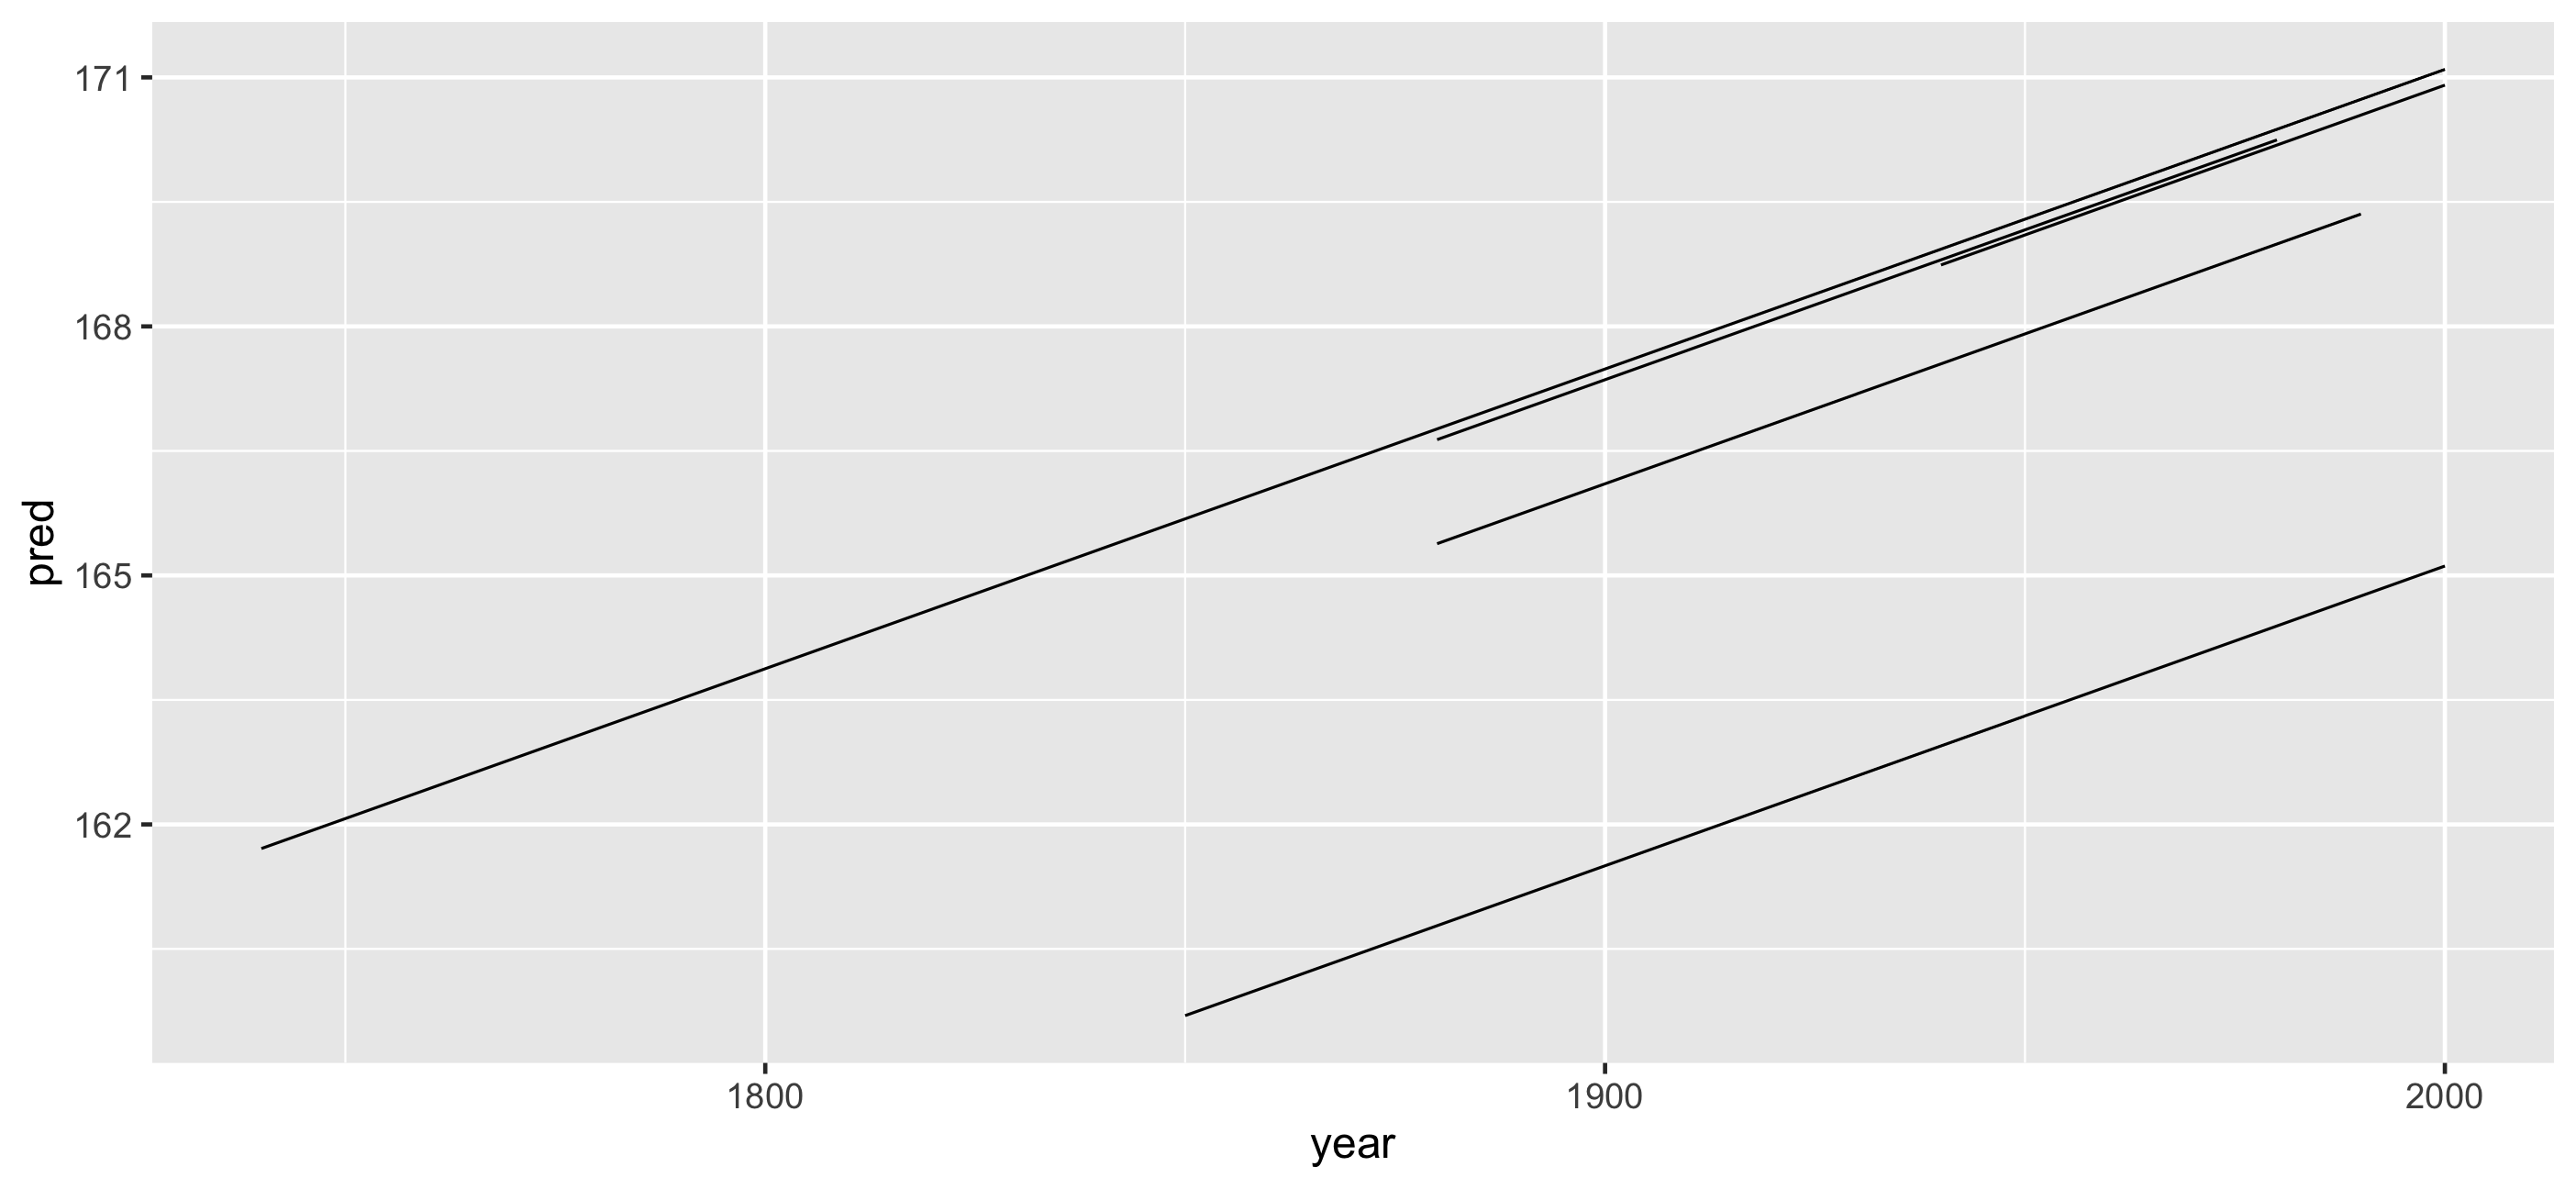
Look at many subsamples?
Look at many subsamples?
gg_heights_fit + facet_sample()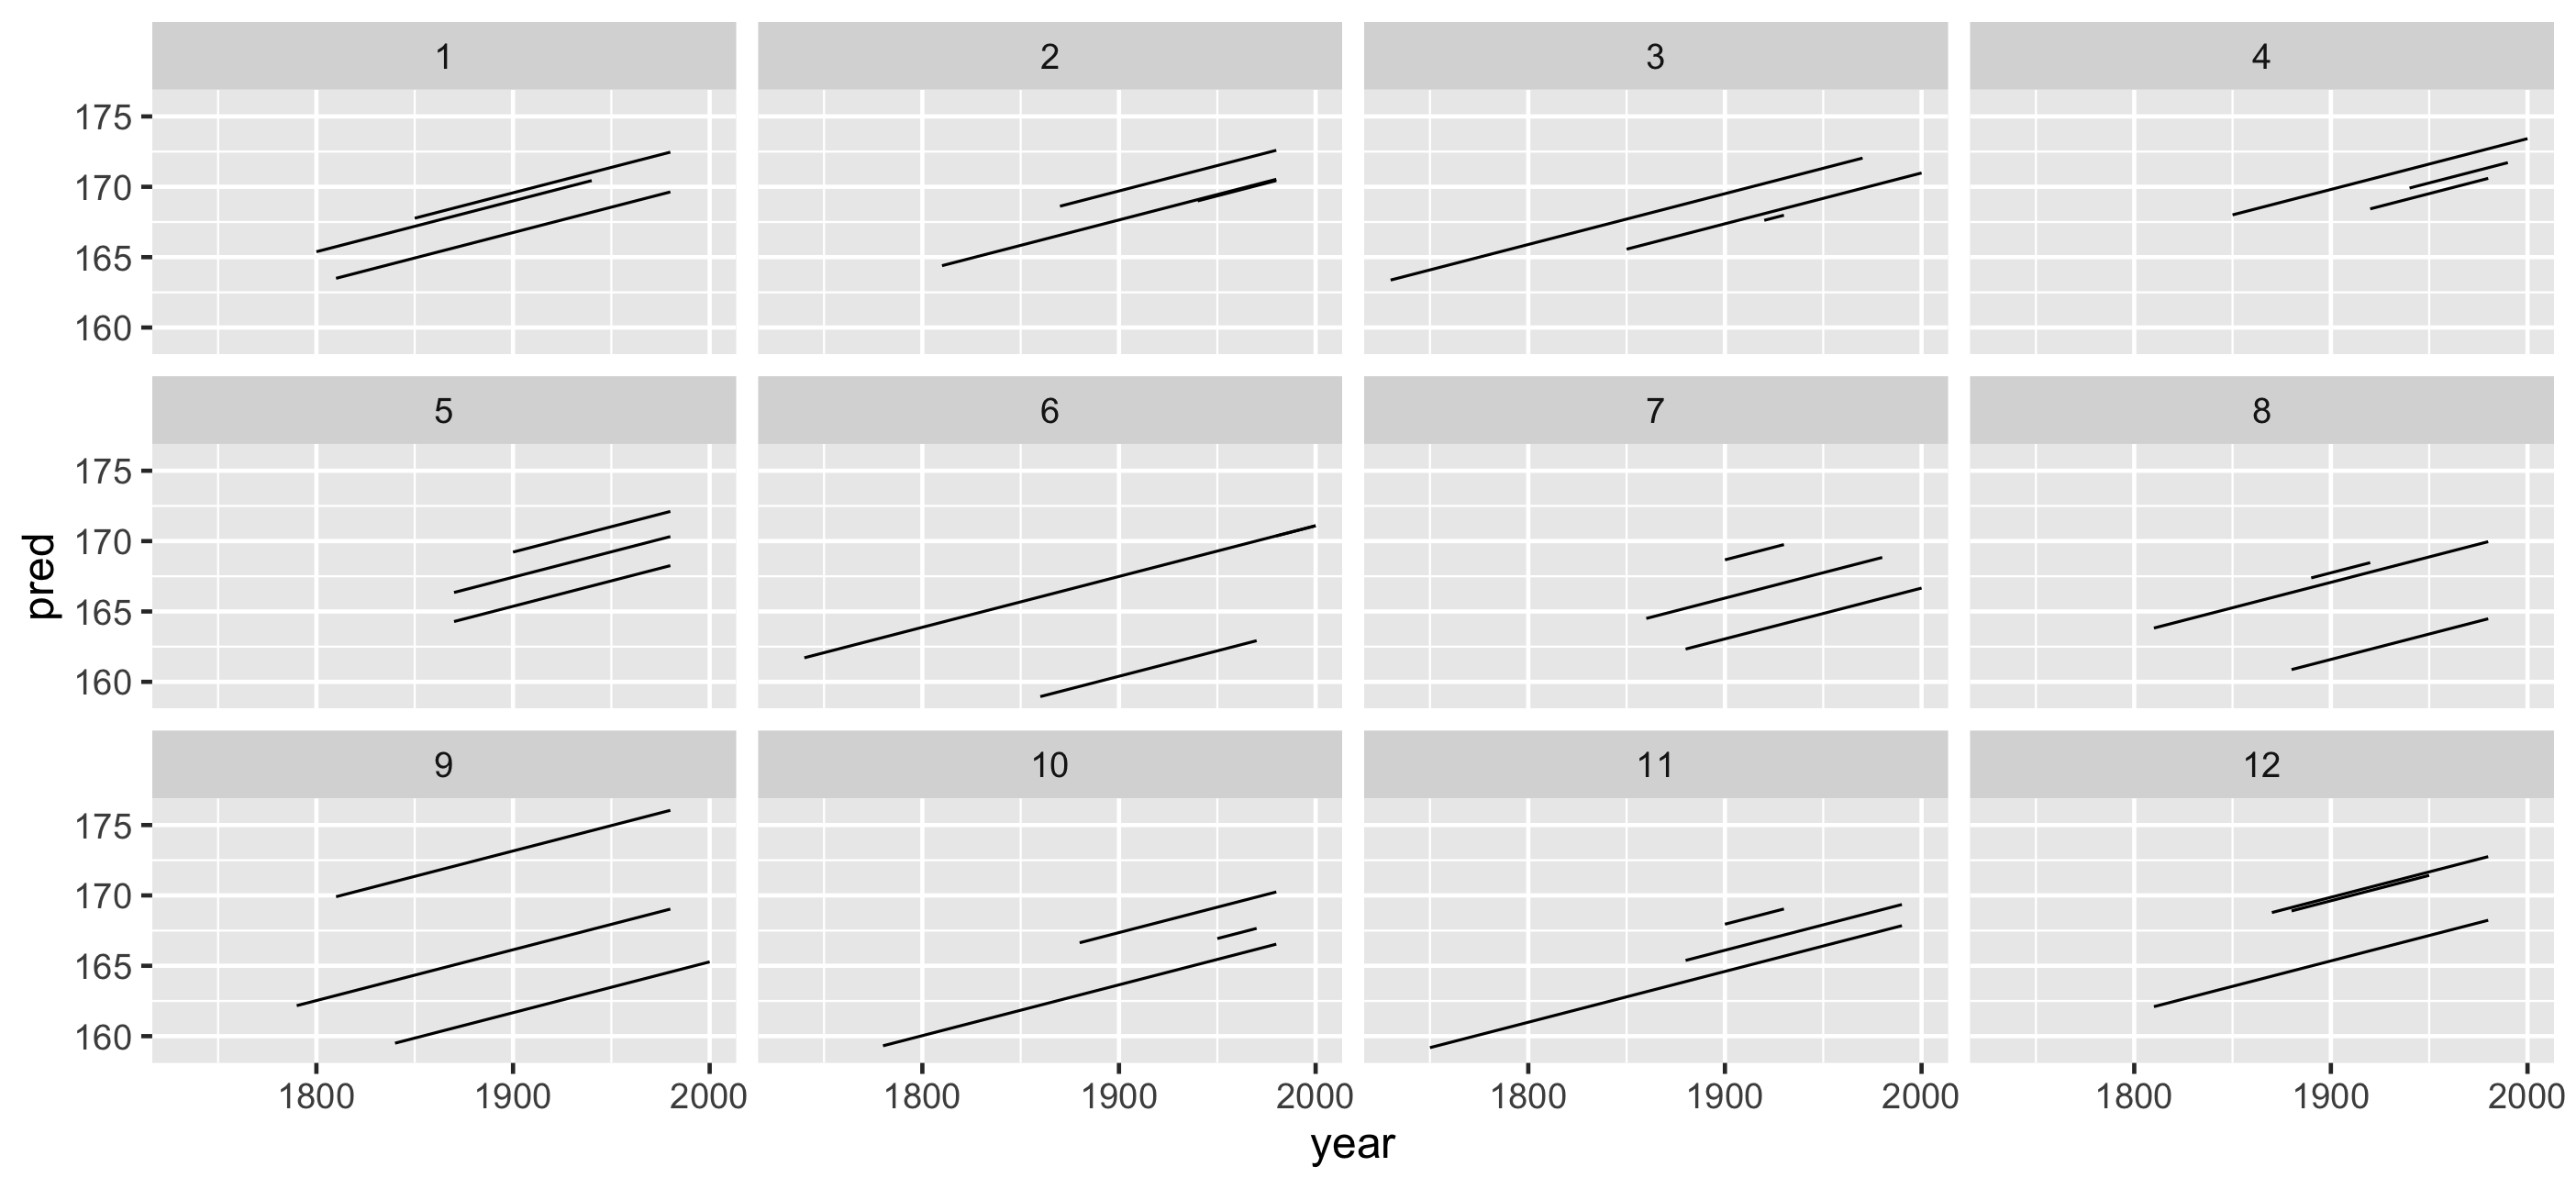
Look at all subsamples?
gg_heights_fit + facet_strata()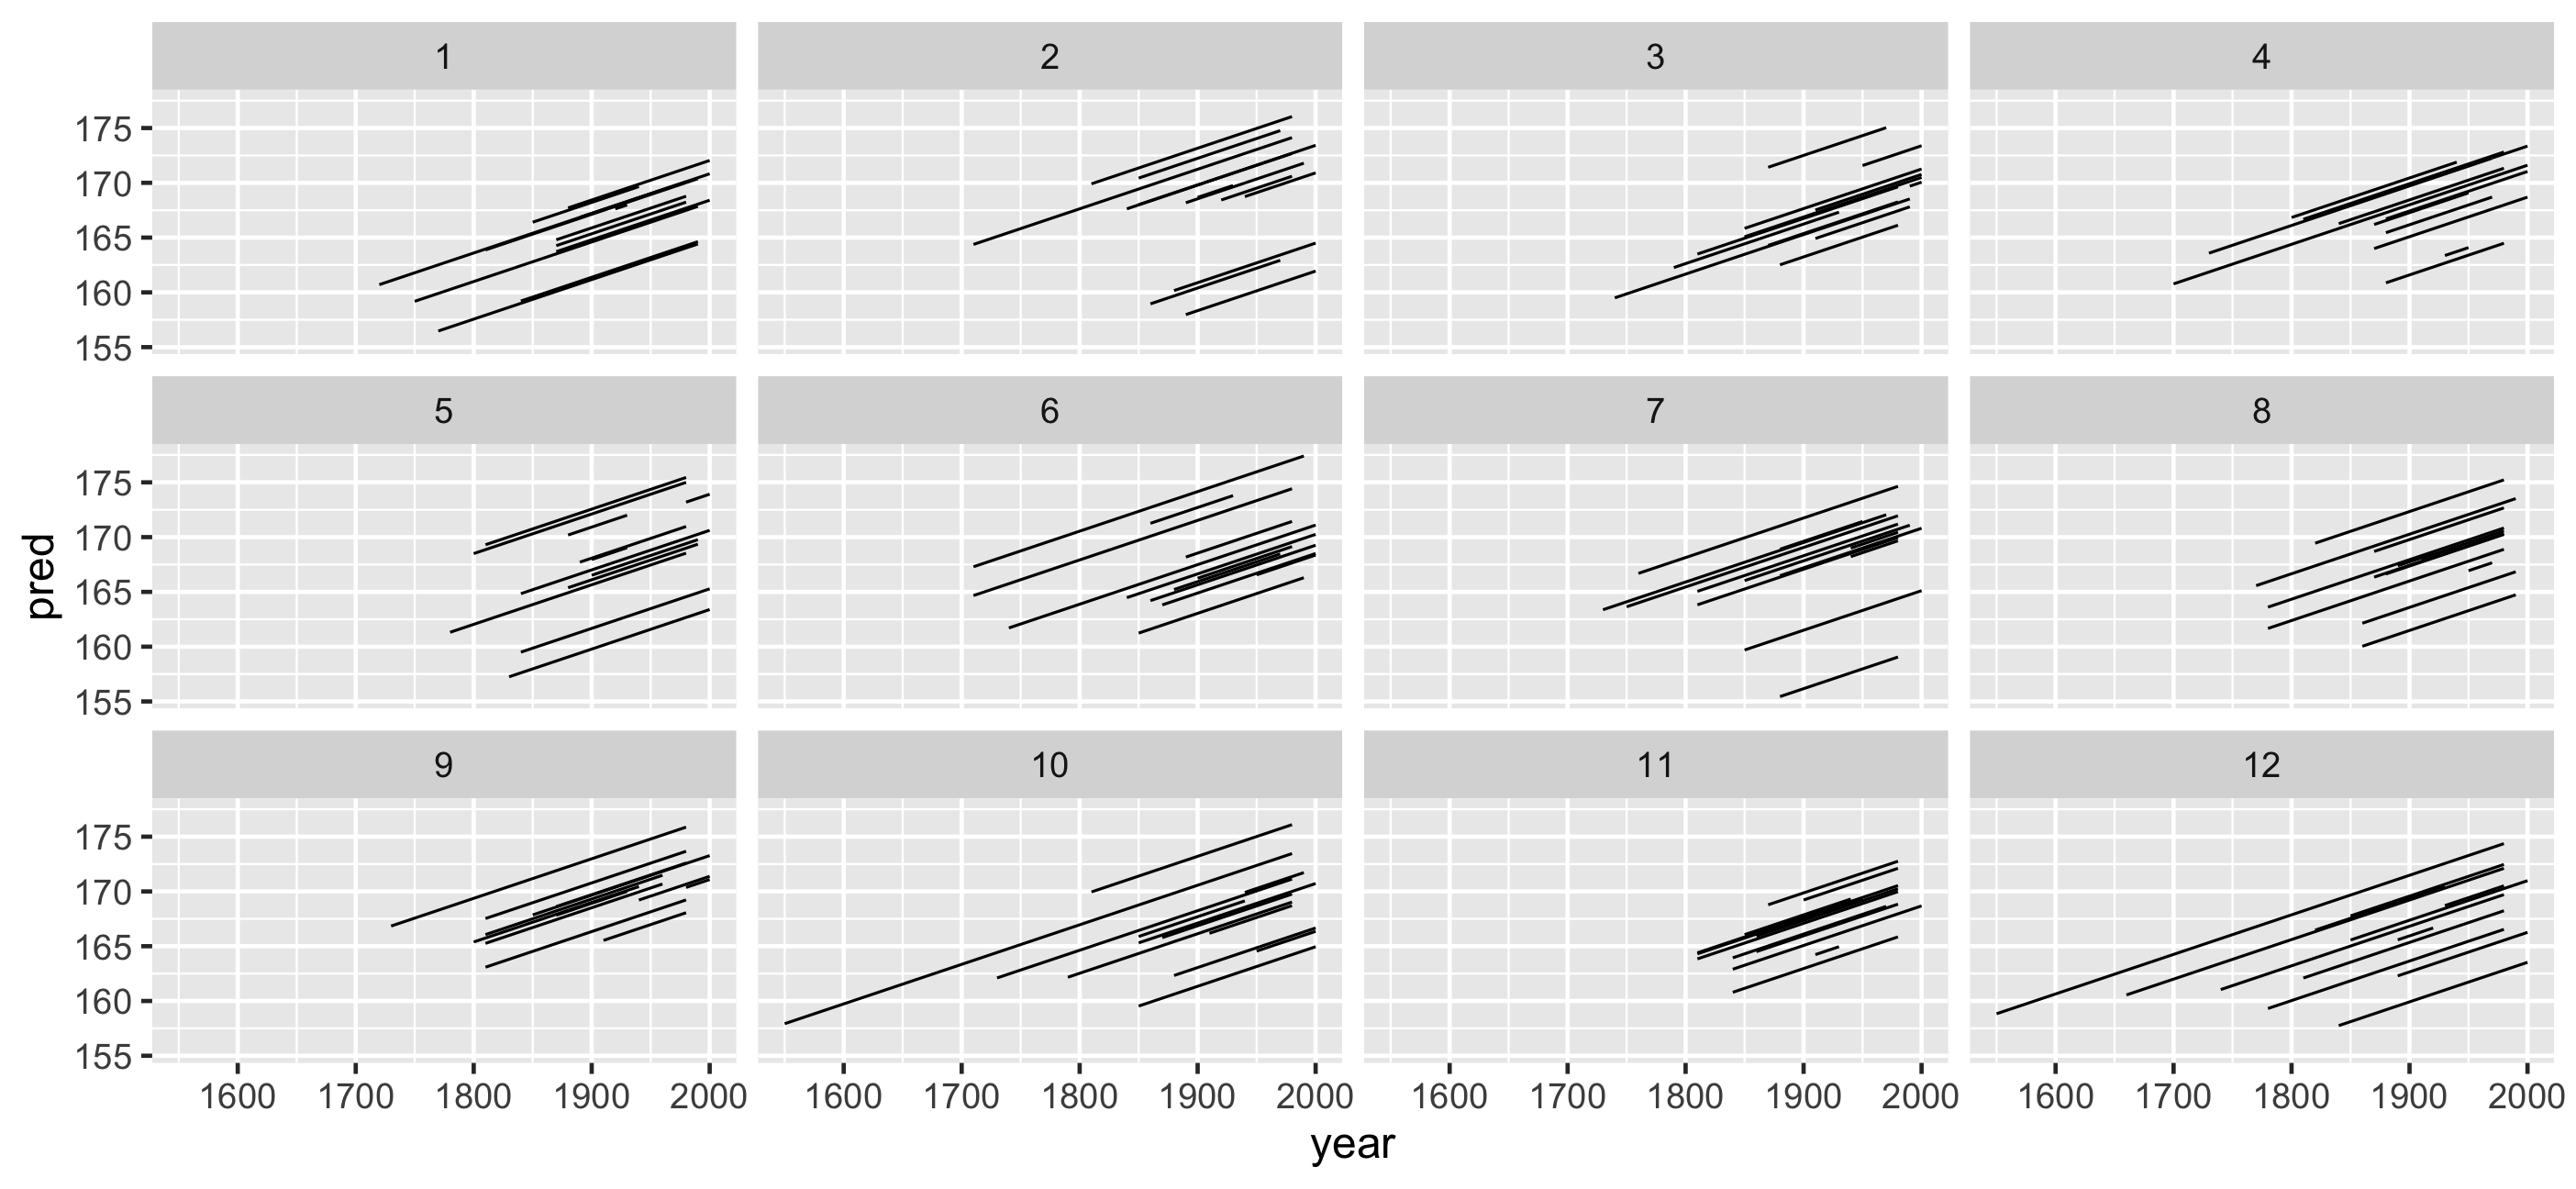
Look at all subsamples along residuals?
gg_heights_fit + facet_strata(along = -res)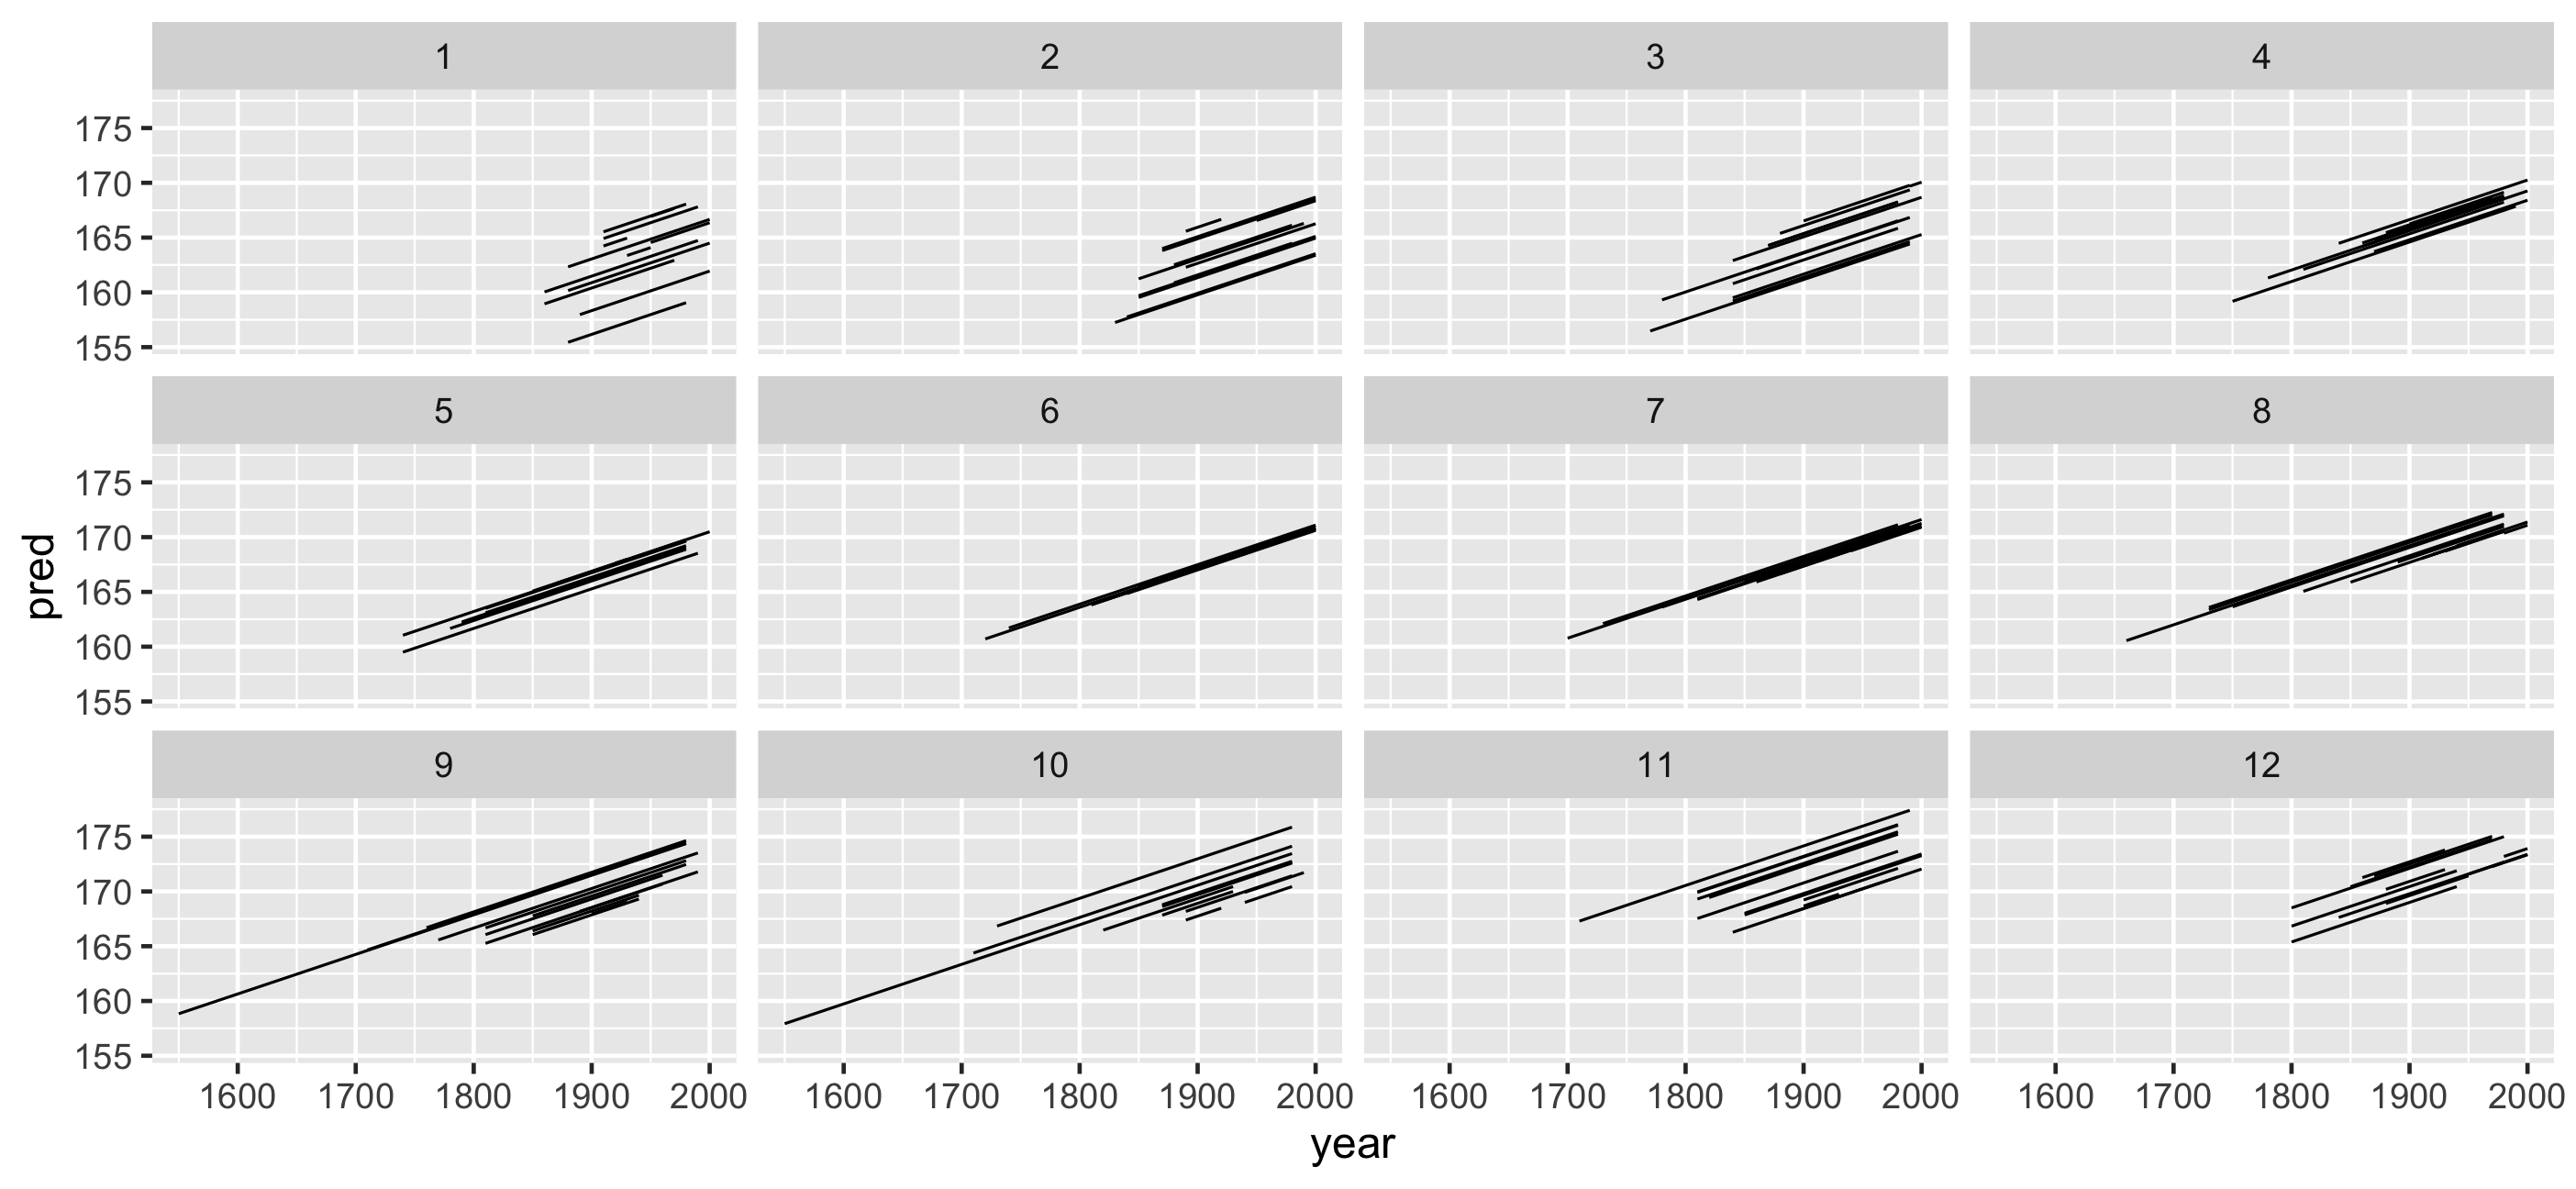
Look at the predictions with the data?
set.seed(2019-11-13)heights_sample <- heights_aug %>% sample_n_keys(size = 9) %>% #<< sample the data ggplot(aes(x = year, y = pred, group = country)) + geom_line() + facet_wrap(~country)heights_sampleLook at the predictions with the data?
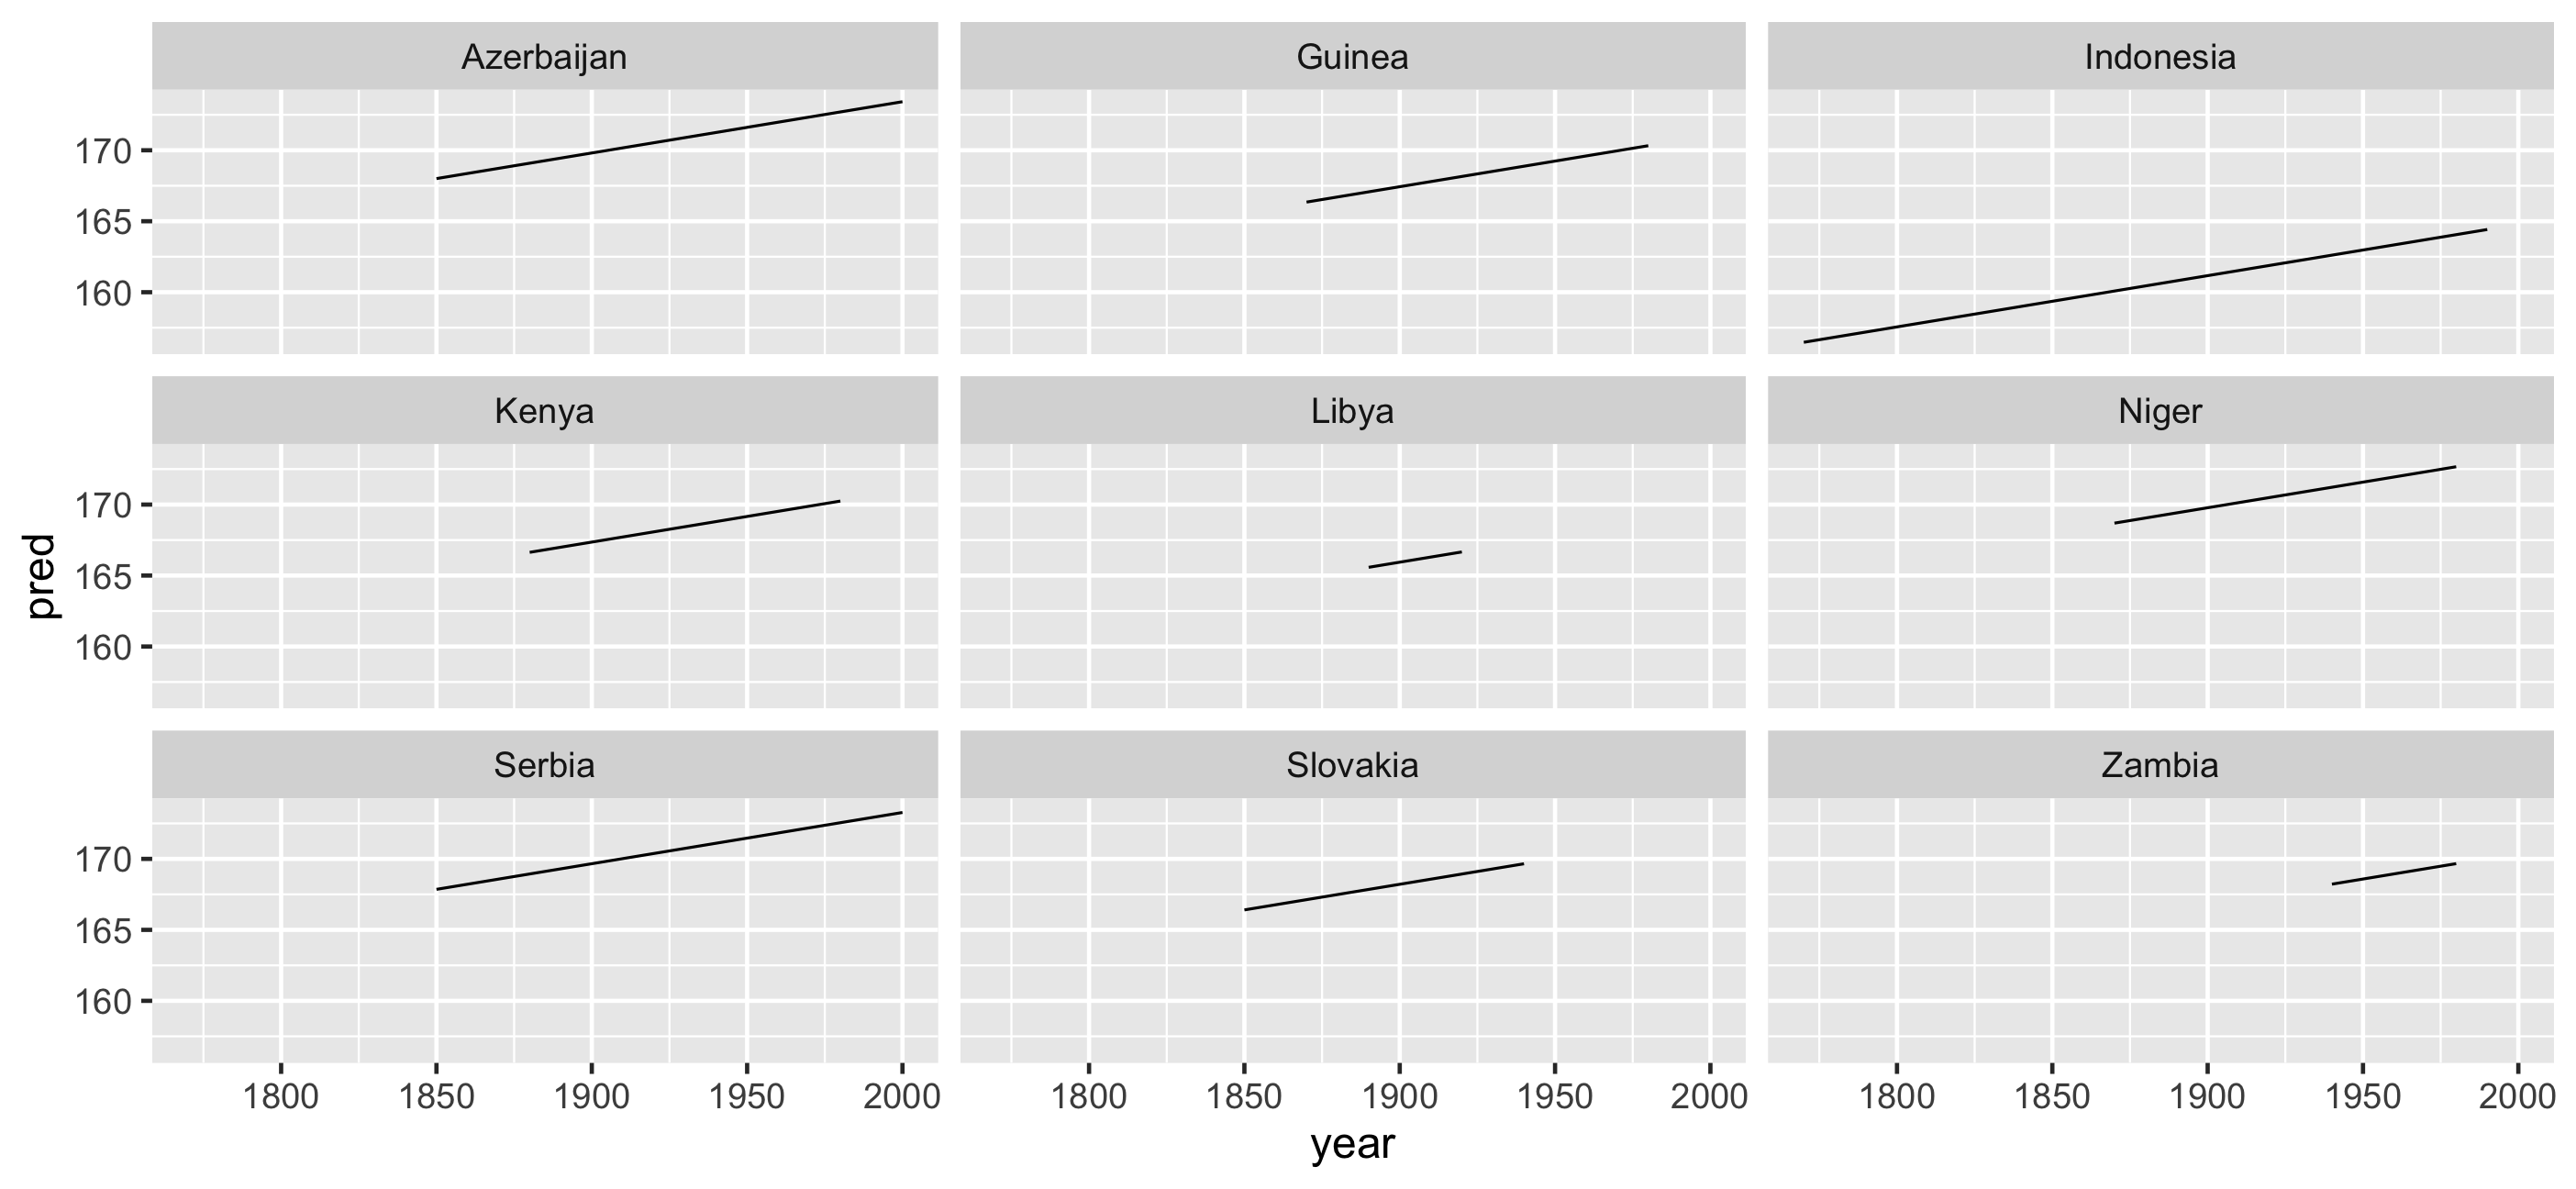
Look at the predictions with the data?
heights_sample + geom_point(aes(y = height_cm))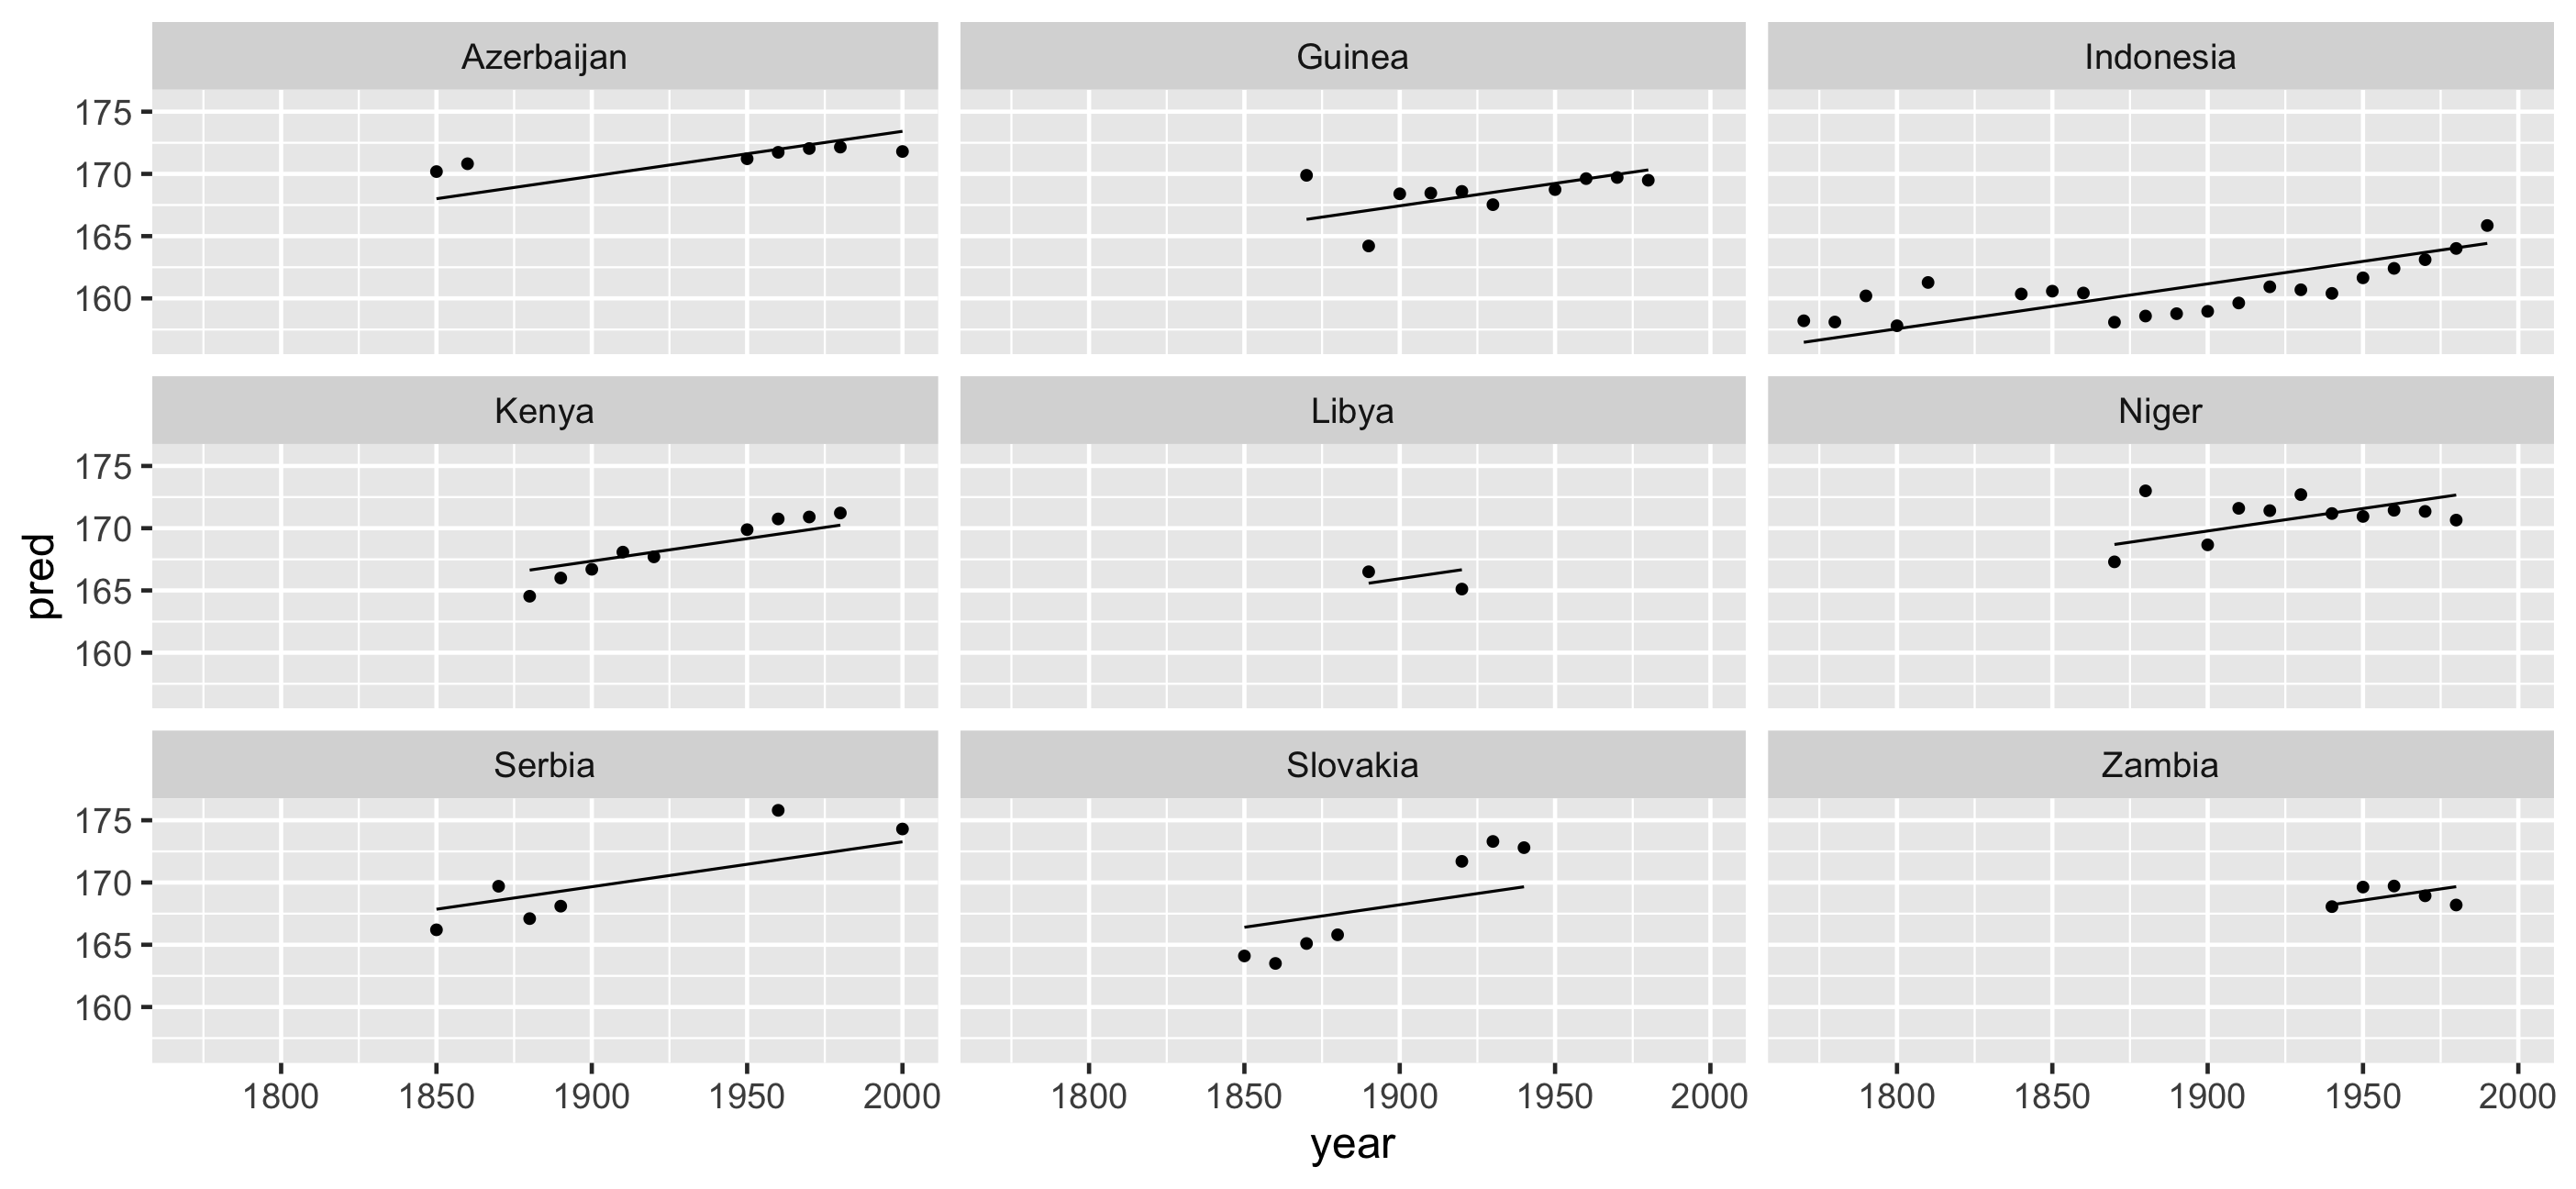
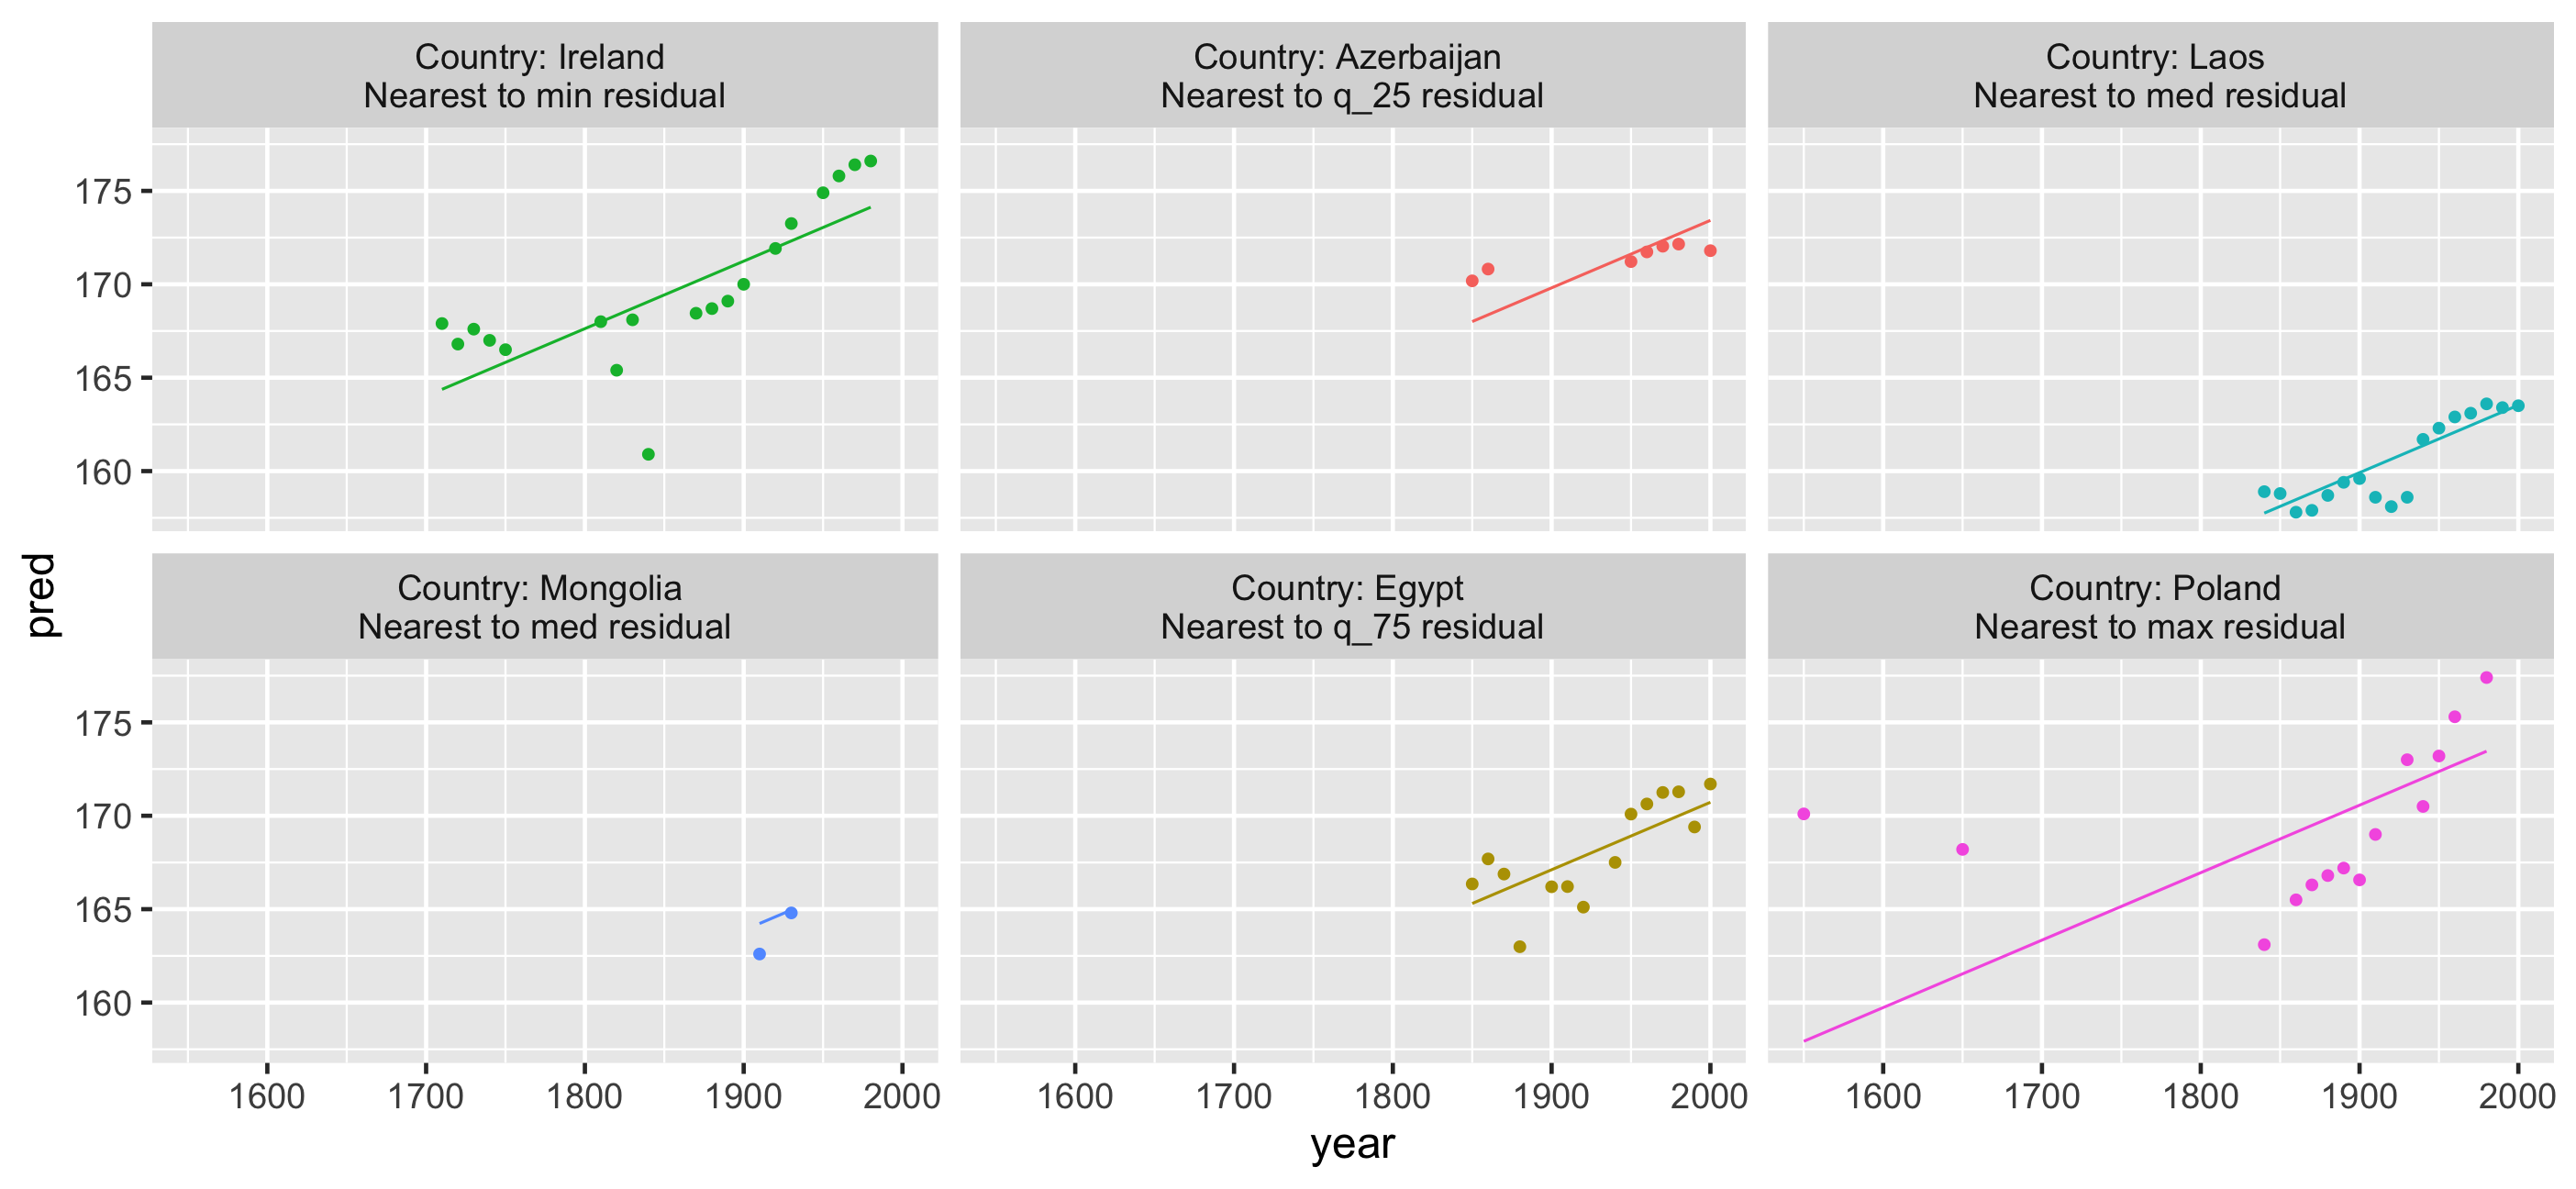
What if we grabbed a sample of those who have the best, middle, and worst residuals?
What if we grabbed a sample of those who have the best, middle, and worst residuals?
summary(heights_aug$res)## Min. 1st Qu. Median Mean 3rd Qu. Max. ## -8.1707 -1.6202 -0.1558 0.0000 1.3545 12.1729What if we grabbed a sample of those who have the best, middle, and worst residuals?
summary(heights_aug$res)## Min. 1st Qu. Median Mean 3rd Qu. Max. ## -8.1707 -1.6202 -0.1558 0.0000 1.3545 12.1729Which countries are nearest to these statistics?
use keys_near()
heights_aug %>% keys_near(key = country, var = res)## # A tibble: 6 x 5## country res stat stat_value stat_diff## <chr> <dbl> <fct> <dbl> <dbl>## 1 Ireland -8.17 min -8.17 0 ## 2 Azerbaijan -1.62 q_25 -1.62 0.000269## 3 Laos -0.157 med -0.156 0.00125 ## 4 Mongolia -0.155 med -0.156 0.00125 ## 5 Egypt 1.35 q_75 1.35 0.000302## 6 Poland 12.2 max 12.2 0This shows us the keys that closely match the five number summary.
Show data by joining it with residuals, to explore spread
Take homes
Problem #1: How do I look at some of the data?
- Longitudinal data is a time series
- Specify structure once, get a free lunch.
- Look at as much of the raw data as possible
- Use
facet_sample()/facet_strata()to look at data
Take homes
Problem #2: How do I find interesting observations?
- Decide what features are interesting
- Summarise down to one observation
- Decide how to filter
- Join this feature back to the data
Take homes
Problem #3: How do I understand my statistical model
- Look at (one, more or all!) subsamples
- Arrange subsamples
- Find keys near some summary
- Join keys to data to explore representatives
Thanks
- Di Cook
- Tania Prvan
- Stuart Lee
- Mitchell O'Hara Wild
- Earo Wang
- Rob Hyndman
- Miles McBain
- Monash University
Resources
Colophon
- Slides made using xaringan
- Extended with xaringanthemer
- Colours taken + modified from lorikeet theme from ochRe
- Header font is Josefin Sans
- Body text font is Montserrat
- Code font is Fira Mono
Learning more
End.
now let's go through these same principles:
- Sample the fits
- Many samples of the fits
- Explore the residuals
- Find the best, worst, middle of the ground residuals
- follow the "gliding" process again.
Which are most similar to which stats?
- "who is similar to me?"
- "who is the most average?"
- "who is the most extreme?"
- "Who is the most different to me?"
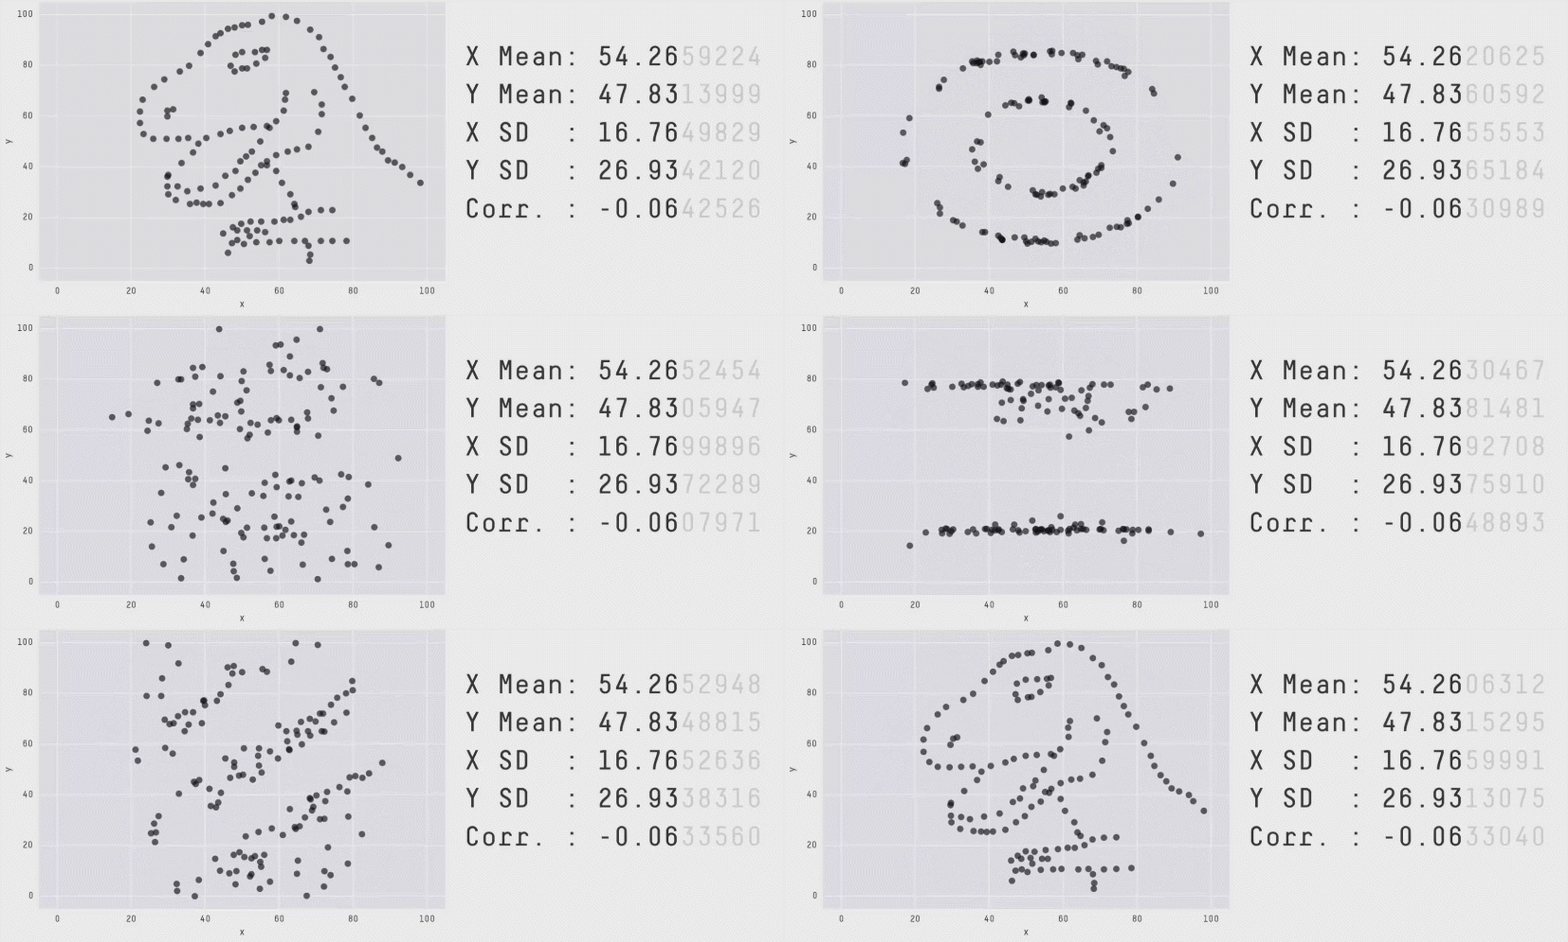
EDA: Why it's worth it
Anscombe's quartet
